Curated OER
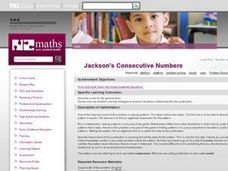
Jackson's Consecutive Numbers
Students generate patterns from a structured problem, finding a rule for the general term, and expresses it in words and symbols. They then devise and use problem solving strategies to explore situations mathematically.
Curated OER
The Old Chicken Run Problem
Sixth graders apply problem solving strategies to work with a real life situation in which they need to determine the area. They determine the area of chicken runs that are rectangular in shape when give a partial perimeter.
Curated OER
Gummy vs. Gum
Students explore numbers patterns and write equations to describe the pattern. They apply the equations to further the patterns.
Pennsylvania Department of Education
Alike and Different
Students compare and contrast objects and are introduced to a Venn Diagram. In this alike and different instructional activity, students make observations regarding properties of objects. Students classify object and build ideas about...
Curated OER
Review for the Algebra One SOLs
Students review the standards for Algebra I. Using the text, they discover two problems that match each standard and solve them showing all steps on paper. They create a PowerPoint slide for each problem and go through the correct...
Curated OER
Addition and Subtraction of Signed Numbers
Students explore the concept of adding and subtracting using positive and negative numbers. In this addition and subtraction of signed numbers lesson, students use pennies to represent positive and negative numbers. Students deposit and...
Curated OER
Perimeters, Patterns, and Conjectures
Students discover patterns and write conjectures relating to perimeters and polygons. Working in cooperative learning groups, they use manipulatives and graphic organizers to solve problems then answer a series of questions in which they...
Curated OER
Riemann Sums
In this calculus activity, students solve prolbem in which they estimate double integrals by using Riemann sums. The three page activity contains four questions. Answers are not included.
Curated OER
Ratios and Proportions
This study guide would be great to use when presenting a lesson on ratios and proportions. It includes clear definitions, explanations, and examples to work through as a class or individually. In addition, it has notes on rates and...
Curated OER
Weighted Averages
Weighted averages can be tricky to explain! However, this study guide makes it easy for teachers by including definitions, explanations, and breaking down problems into three steps. Includes mixture problems and uniform motion problems.
Curated OER
Calculate the Slope of a Line Using Two Points
Find that slope! This video does an excellent job of demonstrating how to use the slope formula to find the slope of a line using two points. The instructor first reviews the definition of slope of a line, then works three problems using...
Curated OER
Inquiry Unit: Modeling Maximums and Minimums
Young mathematicians explore the maximun area for patio with the added complexity of finding the mimimum cost for construction. First, they maximize the area of a yard given a limited amount of fence and plot width v. area on a scatter...
Inside Mathematics
Scatter Diagram
It is positive that how one performs on the first test relates to their performance on the second test. The three-question assessment has class members read and analyze a scatter plot of test scores. They must determine whether...
Inside Mathematics
Snakes
Get a line on the snakes. The assessment task requires the class to determine the species of unknown snakes based upon collected data. Individuals analyze two scatter plots and determine the most likely species for five additional data...
Curated OER
Dental Impressions
What an impressive task it is to make dental impressions! Pupils learn how dentists use proportional reasoning, unit conversions, and systems of equations to estimate the materials needed to make stone models of dental impressions....
Inside Mathematics
Quadratic (2009)
Functions require an input in order to get an output, which explains why the answer always has at least two parts. After only three multi-part questions, the teacher can analyze pupils' strengths and weaknesses when it comes to quadratic...
Mathematics Vision Project
Module 5: Modeling with Geometry
Solids come in many shapes and sizes. Using geometry, scholars create two-dimensional cross-sections of various three-dimensional objects. They develop the lesson further by finding the volume of solids. The module then shifts to finding...
Pennsylvania Department of Education
Analyzing Numeric and Geometric Patterns of Paper Pool
Students use concrete and pictorial representation of geometric patterns to extend patterns. In this geometric patterns lesson plan, students identify patterns and extend them.
Curated OER
Systems of Equations
In this algebra worksheet, students factor systems of equations using elimination and substitution. THey graph their lines and find the point of intersection. There are 15 questions.
Curated OER
Algebra I: The Play
Students create their plays to demonstrate concepts from Algebra I. They collaborate in small groups to add music and dancing to their plays. They analyze the suggestions from the previous class as they revise their plays.
Curated OER
Algebra I: The Play
Students revise their Algebra plays. They collaborate in small groups to work on different aspects of the play and report to the class. They make modifications to their plans and review the Musical Rubric to incorporate the concepts...
Curated OER
Slope & Rate of Change
This short handout addresses the concept of slope in two different ways: geometrically and analytically. Start with a brief description of slope, then use graphical representations to compare positive vs. negative slope and zero vs....
Virginia Department of Education
Factoring for Zeros
Relate factors to zeros and x-intercepts. Scholars first graph quadratics in both standard and factored forms to see that they are the same. They go on to use the graphs to see the relationship between factors and x-intercepts.
Curated OER
How Alike Are We?
Fourth graders find the range, mode, median, and mean for each of the data sets (height and shoe size). They discuss which measure of central tendency for each data set best represents the class and why. Students graph the shoe size and...


