Curated OER
Rows of Numbers
High schoolers generate patterns from a structured situation, find a rule for the general term, and express it in words and symbols. They also devise and use problem solving strategies in a systematic way.
EngageNY
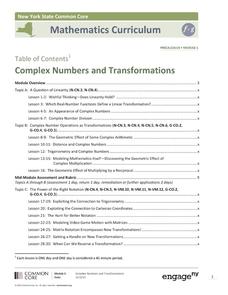
Complex Numbers and Transformations
Your learners combine their knowledge of real and imaginary numbers and matrices in an activity containing thirty lessons, two assessments (mid-module and end module), and their corresponding rubrics. Centered on complex numbers and...
Alabama Learning Exchange
Classifying Complex Numbers
Imaginary numbers are a real thing. Scholars learn about complex numbers, real numbers, and imaginary numbers. They classify given numbers as strictly complex, strictly real, or strictly imaginary in an individual or group activity.
Curated OER
Worksheet 13 - Implicit Differentiation
In this implicit differentiation worksheet, students differentiate expressions and identify the derivative of a function. This one-page worksheet contains six multi-step problems.
Curated OER
Worksheet 17-Fall 1995
In this math worksheet, students find y' both implicitly and explicitly for given relations. They find y' using implicit differentiation for a given relation. Students prove the Pythagorean Theorem
Curated OER
How Simple Is Your Rational Expression?
Investigate simplifying rational expressions. Learners define rational expressions, review how numerators and denominators are polynomials and complete several problems using a checklist to ensure they don't skip any steps. Work can be...
Curated OER
To Quote or Not to Quote
Introduce your middle and high schoolers to the correct use of quotation marks. They identify examples of correct and incorrect quotations in magazines and edit a paragraph in groups. Use this lesson as a way to reinforce proofreading...
Shodor Education Foundation
InteGreat
Hands-on investigation of Riemann sums becomes possible without intensive arithmetic gymnastics with this interactive lesson plan. Learners manipulate online graphing tools to develop and test theories about right, left, and...
Achieve
Ivy Smith Grows Up
Babies grow at an incredible rate! Demonstrate how to model growth using a linear function. Learners build the function from two data points, and then use the function to make predictions.
Curated OER
Polynomials and Linear Factors
This algebra worksheet reviews writing polynomials in standard form from factored form, looks at the graphs of polynomials of degree higher than two, and identifies the zeros of polynomials using the Factor Theorem and Fundamental...
Curated OER
Rewriting Confusing Sentences
A complete page of explanation precedes a sheet with eight confusing sentences that learners revise for clarity. You could show the first page to your class, or just use it as a guide for direct instruction on the issue of clarifying...
Curated OER
Adding and Subtracting Algebraic Expressions (Combining Like Terms)
Everyone loves math when it includes food! This lesson tries to take the notion of combining like terms in algebra and comparing it to sorting apples and oranges. It takes a step-by-step approach to helping students understand this...
Curated OER
Lesson 19: Rational Functions and Long Division
Explore rational functions with this packet. A lot of information is provided, including several examples. Learners graph rational functions and find vertical, horizontal, and oblique asymptotes. This seven-page worksheet contains...
Curated OER
Topsy-Turvy Math With Rational Numbers
Fourth graders complete a worksheet. As a whole class, 4th graders hear a lecture and complete a worksheet on factors, multiplicative inverses and reciprocals, finding the quotient of two fractions and the division of fractions to...
Curated OER
Probability of an event Occurring
In this probability worksheet, 11th graders calculate what the probability of the color of shirt someone is wearing is. There is a solution key with this problem.
Curated OER
e, pi, and Exponential Functions
Students investigate e, pi and exponents. In this calculus lesson, students define constants and non-constants using, pi, e and exponents as an example. They use the TI to work the problems in this lesson.
Kenan Fellows
Half-Life
Scholars shake their way to understanding half-life with the help of candy. They observe and record which side candy lands on to graph the exponential decay in the fifth lesson of seven integrating chemistry and algebra. Combining...
Radford University
Sleep and Teen Obesity: Is there a Correlation?
Does the number of calories you eat affect the total time you sleep? Young mathematicians tackle this question by collecting their own data and making comparisons between others in the class through building scatter plots and regression...
Virginia Department of Education
Linear Curve of Best Fit
Is foot length to forearm length a linear association? The class collects data of fellow scholars' foot length and the length of their forearms. They plot the data and find a line of best fit. Using that line, they make predictions of...
Inside Mathematics
Snakes
Get a line on the snakes. The assessment task requires the class to determine the species of unknown snakes based upon collected data. Individuals analyze two scatter plots and determine the most likely species for five...
Inside Mathematics
Population
Population density, it is not all that it is plotted to be. Pupils analyze a scatter plot of population versus area for some of the states in the US. The class members respond to eight questions about the graph, specific points and...
Curated OER
Mixed Expressions and Complex Fractions
Students are introduced to mixed expressions and complex fractions. They work through several problems with the instructor and then complete a worksheet.
Curated OER
Conic Sections
Learners, while using a graphing calculator, graph systems of conic sections as well as identify their solutions. They complete various word problems dealing with conic sections with their calculators. In addition, students sketch graphs...
Curated OER
Relating Distance and Velocity Over Time
Students calculate the distance and velocity over time. In this algebra instructional activity, students graph a linear function to represent the distance vers time travel. They interpret their graphs and draw conclusion.


