Curated OER
How the Environment Effects our Feelings
First graders compare images and discuss their feelings created by an artist's work. They explore the correlation between experiencing feelings in art and literature and feelings caused by changes in weather.
Curated OER
Graphing Data - Temperature
Seventh graders measure and record temperature over a given time period. They compare the recorded temperatures to the 40-year recorded normal average temperatures for the same area. Students display and interpret their findings in a graph.
Curated OER
Air Masses
Students examine the physical characteristics of several types of air masses to discover how air masses can be identified and defined by their temperature and moisture content.
Curated OER
What is Temperature?
Learners study the effects of temperature and air expansion. In this temperature lesson, students discuss temperature and participate in a role play of low energy and high energy molecules. Learners then discuss their activity and...
NASA
Earth's Global Energy Budget
Introduce your earth science enthusiasts to the earth's energy budget. Teach them using an informative set of slides that include illuminating lecturer's notes, relevant vocabulary, embedded animations, colorful satellite maps, and a...
Curated OER
Trends of Snow Cover and Temperature in Alaska
Learners gather historical snow cover and temperature data from the MY NASA DATA Web site. They compare this data to data gathered using ground measurements from the ALISON Web site for Shageluk Lake. They graph both sets of data and...
Curated OER
Radiation Comparison Before and After 9-11
Using the NASA website, class members try to determine if changes could be detected in cloud cover, temperature, and/or radiation measurements due to the lack of contrails that resulted from the halt in air traffic after the attacks...
Curated OER
NIGHT AND DAY: DAILY CYCLES IN SOLAR RADIATION
Students examine how Earth's rotation causes daily cycles in solar energy using a microset of satellite data to investigate the Earth's daily radiation budget and locating map locations using latitude and longitude coordinates.
Curated OER
A Comparison of Land and Water Temperature
Learners examine NASA satellite observations of surface temperature and investigate the seasonal changes of land and water temperature.
Curated OER
Seasons and Cloud Cover, Are They Related?
Students use NASA satellite data to see cloud cover over Africa. In this seasons lesson students access data and import it into Excel.
Curated OER
Hurricane Frequency and Intensity
Students examine hurricanes. In this web-based meteorology lesson, students study the relationship between ocean temperature and hurricane intensity. They differentiate between intensity and frequency of hurricanes.
Curated OER
Three Clouds Activity
Students understand how clouds are formed. In this cloud lesson, students participate in three experiments to make clouds. Students complete activity sheets for each experiment.
Curated OER
Does Cloud Type Affect Rainfall?
Student uses MY NASA DATA to obtain precipitation and cloud type data. They create graphs of data within MY NASA DATA. They compare different cloud types as well as precipitation types. They describe graphs of the precipitation and cloud...
Curated OER
Floodplain Modeling
Students simulate the impact of fluctuating river volumes on structures and landforms. They experiment with table top-sized riverbed models and water. Students consider how human design can help mitigate the effects of a flood.
Curated OER
Scientist Tracking Network
Students correlate surface radiation with mean surface temperature of several geographic regions. They observe how these parameters change with latitude and construct an understanding of the relationship of solar radiation to seasonal...
Curated OER
Seasonal Cloud Cover Variations
Learners, in groups, access data from the NASA website Live Access Server regarding seasonal cloud coverage and the type of clouds that make up the coverage. They graph the data and make correlations between types, seasons and percentages.
Curated OER
Sustainable Livestock
Learners investigate healthy eating habits by researching livestock. In this food sustainability lesson, students research the negative impact factory farming has on our environment due to pollution. Learners define agricultural...
Curated OER
Solar/Lunar Eclipses and the Seasons
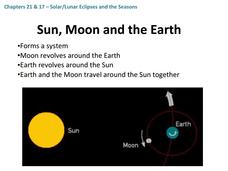
How do the moon, sun, and Earth line up to create eclipses? Why do the seasons change throughout a year? The answers to these questions are explained through this series of slides. This apt presentation outlines information using bullet...
Science Geek
Bulk Properties of Water
Learn the ins and outs of the properties of water through an engaging slide show. The lesson presents different facts about water including phase change, heat of fusion, heat of vaporization, and specific heat among others.
Calvin Crest Outdoor School
Survival
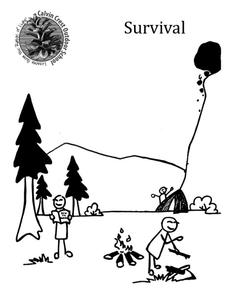
Equip young campers with important survival knowledge with a set of engaging lessons. Teammates work together to complete three outdoor activities, which include building a shelter, starting a campfire, and finding directions in the...
NOAA
Technology I
Isn't technology great? The 12th installment of a 23-part NOAA Enrichment in Marine sciences and Oceanography (NEMO) program introduces technology that marine scientists use. Pupils take part in an activity using conductivity,...
Curated OER
Three Clouds Activity
Students explore how clouds are produced through three different age-appropriate hands-on experiments.
Curated OER
Trends of Snow Cover and Temperature in Alaska
Students compare NASA satellite data observations with student surface measurements of snow cover and temperature. They practice data collection, data correlations, and making scientific predictions.
Curated OER
Seasonal Cloud Cover Variations
Learners recognize different cloud types. They determine the seaonality of various types of clouds. They graph the data and determine if a correlation exists between season, cloud cover and type of clouds most prevalent during each season.


