CK-12 Foundation
Ck 12: Displacement During Constant Acceleration
[Free Registration/Login may be required to access all resource tools.] Students solve problems involving displacement, distance, velocity, speed, and acceleration, and then explore problems and graphs involving one-dimensional motion.
Other
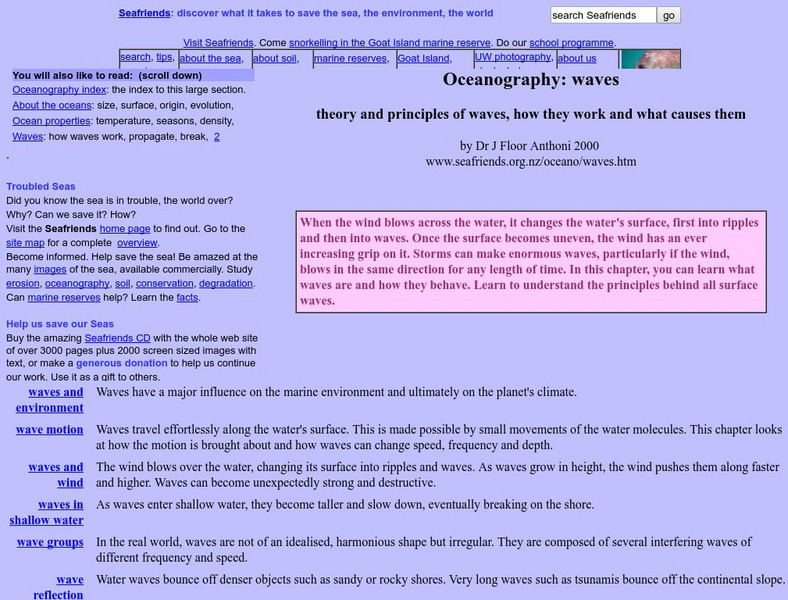
Seafriends Marine Conservation and Education Centre: Oceanography: Waves
A very detailed article on the characteristics of waves and wave behavior. It discusses the influence waves have on the marine environment and the global climate, the physics of wave motion, the interactions between waves and wind, wave...
Other
Calculus Preview
The resource gives students a preview of topics learned in Calculus. Concepts included are graphs, speed, and integration. Graphs, tables, and an interactive applet are used to investigate the examples.
CK-12 Foundation
Ck 12 Exploration Series: Simulations: Physics: Butterfly Stroke
[Free Registration/Login Required] Learn about the relationship between velocity and position for a swimmer. Adjust the velocity of the legs, streamline, and arms to experiment with the slope of velocity in the simulation swimmer. Dig a...
Texas Instruments
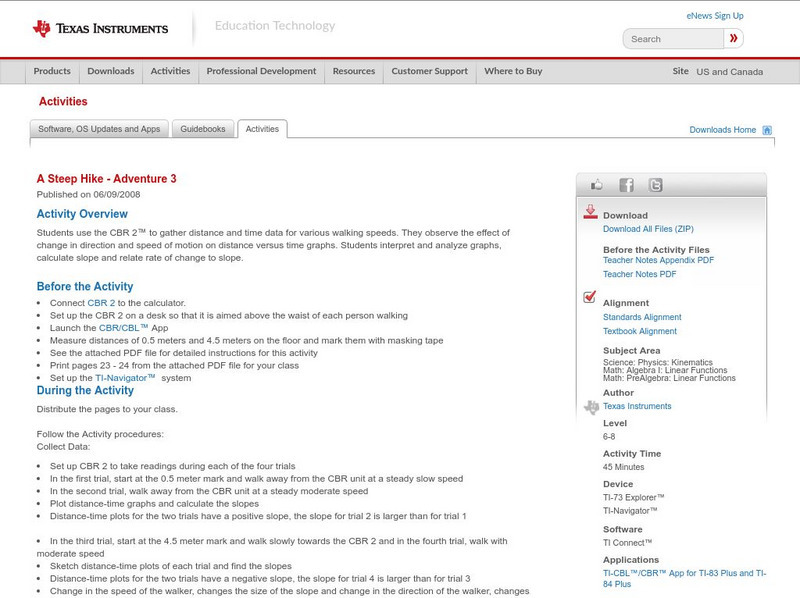
Texas Instruments: A Steep Hike Adventure 3
Students use the CBR 2 to gather distance and time data for various walking speeds. They observe the effect of change in direction and speed of motion on distance versus time graphs. Students interpret and analyze graphs, calculate slope...
CK-12 Foundation
Ck 12: Plix: Motion: Changing Speeds
[Free Registration/Login Required] Drag the red dot to draw a position-time graph for a sprinter with changing speeds.
Concord Consortium
Concord Consortium: Molecular Workbench: Maxwell Speed & Velocity Dist.
Adjust the temperature in this simulation to observe the effects to moving particles. Graphs can be created from collected data.
Texas Instruments
Texas Instruments: Falling Down Adventure 5
Students use the CBR 2 to study how a change in mass affects the average speed of a falling object. They graph distance as a function of time, and interpret and analyze graphs representing motion.
Physics Classroom
The Physics Classroom: 1 D Kinematics: Table of Contents
Learners examine motion with words, equations, diagrams, and graphs. Some topics investigated are position, velocity, acceleration, and free fall. The tutorial consists of lessons and problems to check for understanding.
Alabama Learning Exchange
Alex: The Need for Speed
After viewing an introductory illustrated podcast on speed, distance, time, and velocity, middle schoolers explore distance-time graphs using interactive websites. Working in cooperative learning groups, students will investigate the...
CK-12 Foundation
Ck 12 Exploration Series: Simulations: Physics: Archery
[Free Registration/Login Required] Watch this animation as an archer shoots at a target on an angle, and its horizontal and vertical paths and its velocity are explained. An interactive follows where you can manipulate the archer's...
Science and Mathematics Initiative for Learning Enhancement (SMILE)
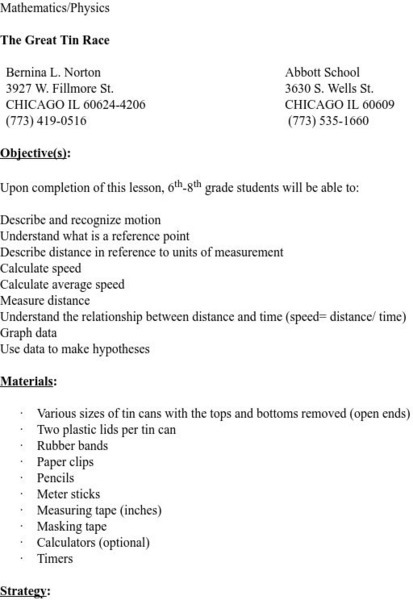
Smile: The Great Tin Race
This activity is a great way to show distance and time relationships while incorporating charts and graphing. Different sized tins are raced against each other, and data is collected.
CK-12 Foundation
Ck 12 Exploration Series: Simulations: Physics: Model Rocket
[Free Registration/Login Required] Learn about the relationship between position and velocity for a model rocket during launch and in free-fall. Experiment with rocket mass, rocket thrust, and rocket burn time to understand the...
Texas Instruments
Texas Instruments: Match Me!
In this activity, students move in a specific way in front of the motion detector to create motion plots that match a given Distance versus Time plot. They make connections between types of movements and characteristics of Distance-Time...
Physics Aviary
Physics Aviary: Circular Force Lab
This lab is designed to have students find the relationships that affect the force required to keep an object moving in a circle. Students will be able to modify the mass of the object, the speed of the object and the size of the circle...
Texas Instruments
Texas Instruments: Classroom Activities: Parachuting
This activity explores a parachutist and her position, velocity and acceleration. Graphing and calculating these functions will be required.
Other
Usra: Lunar and Planetary Institute: Hot Spot Activity [Pdf]
In this lesson plan, young scholars will measure the distances between Hawaiian islands, and convert and graph their data to determine the speed of the Pacific Plate.
Physics Aviary
Physics Aviary: Projectile Lab
This lab is designed to have students find the relationships that affect the horizontal distance travelled by a projectile. Students will be able to modify the starting height, initial speed and angle at which the projectile is fired....


