Curated OER
Animating Motion
Young scholars apply what they recall about objects in motion by animati ng sequences of pictures that model a set of physical conditions. They animate the orbital motions of the Earth, the space shuttle, and the Moon based on...
Curated OER
Mathematical Techniques - Basic Graphing
Students are introduced to significant figures and how to add, subtract, multiply and divide them. In a group, they practice plotting data points from a table to a graph and labeling all axes. They calculate the slope and y-intercept and...
Curated OER
Motion Through the Ages
Eighth graders conduct internet research to produce a timeline of man's growth in understanding of concepts of motion and planetary motion through history.
Curated OER
Newton's Second Law of Motion
Sixth graders study Newton's second law of motion and verify it. In this force and motion lesson students complete a lab activity and collect data, analyze it and graph it.
Curated OER
Investigating Motion
Students determine velocity using the slope of a time distance graph. They investigate a motion cart using a CBR unit and a TI 83 calculator setup. Using the graph generated, they calculate velocity.
Curated OER
Velocity and Acceleration
Compliment your physics lesson with this PowerPoint which demonstrates many important points regarding acceleration and velocity. A starter experiment activity to stimulate student thinking is given, and may prove very interesting to a...
Curated OER
Lesson 3: Acceleration and Force
A nine-page physics resource supports your instructional activity on acceleration. A step-by-step lesson plan walks you through the materials you need, the background information, steps for leading experimentation, and the explanation of...
University of Colorado
Happy Landings: A Splash or a Splat?
Huygens spacecraft landed on Saturn's moon Titan in 2005, making it the farthest landing from Earth ever made by a spacecraft. In this hands-on activity, the 12th installment of 22, groups explore how density affects speed. To do this,...
EngageNY
Searching a Region in the Plane
Programming a robot is a mathematical task! The activity asks learners to examine the process of programming a robot to vacuum a room. They use a coordinate plane to model the room, write equations to represent movement, determine the...
CK-12 Foundation
Unicycle
What is the steepness of a hill before a unicyclist slides down it rather than pedaling down it? The simulation graphs the wheel speed versus the unicycle speed as the rider goes down a hill. Scholars control the mass of the rider,...
Radford University
Throwing a Football
Use mathematics to help the football team. Pairs brainstorm how to approach finding a solution to a problem to help the quarterback complete more passes. By researching and collecting data, the teams derive an equation to represent the...
CK-12 Foundation
Newton's Cannon
Gravity does more than keep our feet on the ground — it holds a satellite in orbit, too. Help learners understand the effects of gravity on an orbiting object through a simulation activity. Individuals adjust a launch speed and watch as...
Curated OER
Vectors: Follow That Arrow
Vectors and their connection to motion. A video will be presented to provide information for the class to use methods of solving vectors with and without grids. Real-world physical concepts will be explored in reference to vectors.
Curated OER
The Great Tin Race
Students construct and race tin can cars. In this motion lesson plan, groups build tin racers, complete timed runs, and record their data on the provided worksheet. The teacher leads a discussion comparing data between groups. Specific...
Curated OER
"Go-Car" Lab
Students construct a car based on directions given. In this physics activity, students calculate average speed using distance and time information. They collect data and create a graph of distance vs. time.
Curated OER
Velocity
Pupils determine the average speed of a toy car as it travels six different distances set up by Students. Three trials are done for each distance. The only requirements is that the longest distance must be at least three times longer...
Curated OER
Sand in Bottles
Eighth graders calculate the speed of bottles as they roll down a ramp with varying amounts of sand inside. Using their data, 8th graders estimate speed of three labeled bottles with different amounts of sand and compare those results...
Flipped Math
Calculus AB/BC - Connecting a Function, Its First Derivative, and Its Second Derivative
Uncover what the first and second derivatives reveal about the function. Pupils move beyond sketching graphs to determine what derivatives tell about the function itself. The video reminds learners about particle motion and how to...
Curated OER
Unit III: 3
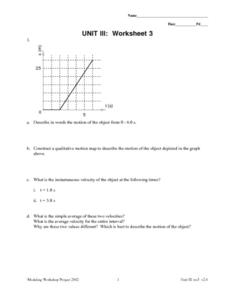
In this unit III: 3 worksheet, students describe motion in words and graph drawings. Students calculate the instantaneous velocity and average velocity. Students also graph the displacement of the object in the word problems.
Curated OER
Extreme Acceleration
Students explore the concept of acceleration. They determine the acceleration rate of a roller-blader and graph the results.
Curated OER
Don’t Sit Under the Apple Tree…You Might Become Famous
Students explore Newton's laws using CEENBoTs. In this physics lesson plan, students collect data and create tables and graphs. They calculate speed, acceleration and forces using mathematical formulas.
Curated OER
Bug Race
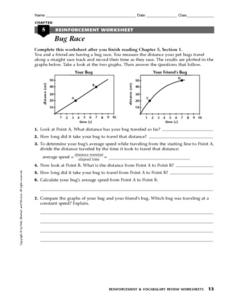
In this motion worksheet, students compare two graphs showing a bug's distance traveled over time. Students calculate the average speed of the bugs and determine which bug was traveling at a constant speed. This worksheet has 1 short...
Curated OER
Let's Go Slopey
Pupils create a table of values to graph a line. For this algebra lesson, students identify the slope and intercept of a linear equation. They use a Ticalculator to graph their function.
Curated OER
Solar Race Cars
Students explore the relationship between time traveled, distance and speed. In this solar race car instructional activity students wire solar batteries using series and parallel circuitry.


