Curated OER
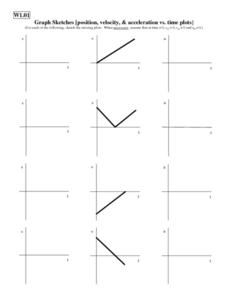
Graph Sketches
In this graphing activity, learners use velocity vs. time graphs to create speed vs. time and acceleration vs. time graphs. Students create 24 graphs.
Curated OER
Velocity
In this velocity worksheet, students solve 13 problems including finding acceleration of objects, forces on objects, velocity of objects and interpreting graphs of position vs. time.
Curated OER
Graphing Your Motion
Seventh graders investigate velocity and speed. In this Vernier Probe instructional activity, 7th graders will use probes to calculate motion, speed, and velocity of an object. They will create a graph of their collected data.
CK-12 Foundation
Cliff Diver
Cliff diving is more than an adrenaline rush ... it's a lesson in physics! Scholars adjust the height of a cliff and plot the resulting velocity and position over time on graphs. They also can incorporate air resistance to monitor the...
Curated OER
Position vs. Time and Velocity vs. Time Graphs
For this constant velocity worksheet, students use data of position vs. time of a roller-skater to determine speed, acceleration, or deceleration at different points along the path. Students rank graphs according to average velocity and...
Curated OER
Vectors: How Much Force Can You Apply
This lesson entails the viewing of two videos to get an overview of force and its application. The lesson covers how vectors use force in real-world situations.
Curated OER
Unit III: Worksheet 3 - Uniform Acceleration
This three-page worksheet moves physics masters to show what they know about motion. They analyze graphs of time versus displacement, solve instantaneous and average velocities, solve word problems, and graph results. This is an...
Curated OER
Unit VII: Worksheet 4 - Energy
Energize your physics class with this energy exercise! Physics learners solve seven problems in which they calculate speed, velocity, or energy values for a variety of situations. This is a suitable homework assignment for high school...
Curated OER
Motion Basics
Quiz those kids to assess what they've gleaned from your last lesson on Newton's laws of motion. There are 10 questions that have learners define force, acceleration, velocity, and speed. A bonus question has them write a motion story...
Curated OER
Typical Numeric Questions for Physics I - Waves
Physics masters figure out the wavelength of different waves. Looking at a wave graph, they identify different characteristics. Many more problems get them working with both electromagnetic and sound waves. There are a total of 17...
Curated OER
Finding Ocean Depth
How to oceanographers measure the sea's depth? Your scientists will step into their shoes in this application worksheet, first reading about how the speed of sound and a simple formula give scientists a depth estimation. Students...
Physics Classroom
Action-Reaction Lab
Computer-interfaced motion detectors are required to carry out this inquiry. It is a new twist on exploring motion with plunger carts: they are set back-to-back and then propelled away from each other. Their velocities are measured, and...
Curated OER
IPC Physics Final Review
In this physics review worksheet, students compare experimental variable, simple machines, and Newton's Laws. Students calculate kinetic energy, work, power, speed, and velocity. Students review conduction, convection, and radiation....
Curated OER
Speed and Distance
In this speed worksheet, learners create time vs. distance graphs to answer questions about average speed, average velocity, and acceleration. This worksheet has 3 problems to solve.
Curated OER
Velocity, Acceleration, and Gravity
Students perform an experiment where a string is tied across the room. A straw is threaded onto the string, and a balloon attached to the straw. Students determine the speed of the balloon as it moves across the string. They repeat the...
Curated OER
Velocity
Students determine the average speed of a toy car as it travels six different distances set up by Students. Three trials are done for each distance. The only requirements is that the longest distance must be at least three times longer...
Curated OER
The Speed of Galaxy Q2125-431
In this speed of a galaxy instructional activity, students use a given equation for the speed of an object and they use the spectral lines for Hydrogen Alpha and Beta from the Seyfert galaxy to answer 6 questions. They determine the...
Curated OER
Elevator Height as Integral of Velocity
Pupils investigate integrals and their relationship to velocity in this calculus lesson. They use the idea of a moving elevator to explore vertical motion and use the TI to help them create a visual.
Bowels Physics
Methods of Motion
How could you earn a $6,000,000 speeding ticket? This presentation uses an analogy that relates speed in the universe to the cost of a speeding ticket. Scholars ultimately understand that motion is relative. Also covered is the concept...
Concord Consortium
Cheetah's Lunch
Run like a cheetah. A performance task challenges pupils to solve several different problems involving the speed of a cheetah. Given information for scenarios where the cheetah chases its prey, they determine if the big cat is fast enough.
101 Questions
Stopping Distances
In 2016, one in every four fatal car crashes listed speeding as a contributing factor. Pupils view videos of a car trying to come to a quick stop from four different rates of speed. They use context clues to measure and determine the...
Curated OER
Motion Graphs
In this motion graphs activity, learners learn about how motion of objects can be described using a graph. Students then answer 10 fill in the blank, 10 short answer, and 5 problems to solve.
Corbett Maths
Average Rate of Change
Simply find the slope to find the average rate of change. A short video provides the definition of the average rate of change. Using the definition, pupils calculate the average rate of change to solve problems that cover finding average...
Curated OER
Position, Velocity & Acceleration vs. Time Graphs
For this graphing worksheet, students determine the speed vs. time and acceleration vs. time plots based on the velocity vs. time graph given. Students complete 2 graphs.


