Physics Aviary
Physics Aviary: Graphing Motion Problem Level 1 Part 2
Students are finding the relative velocity between two objects using a position vs. time graph.
Texas Instruments
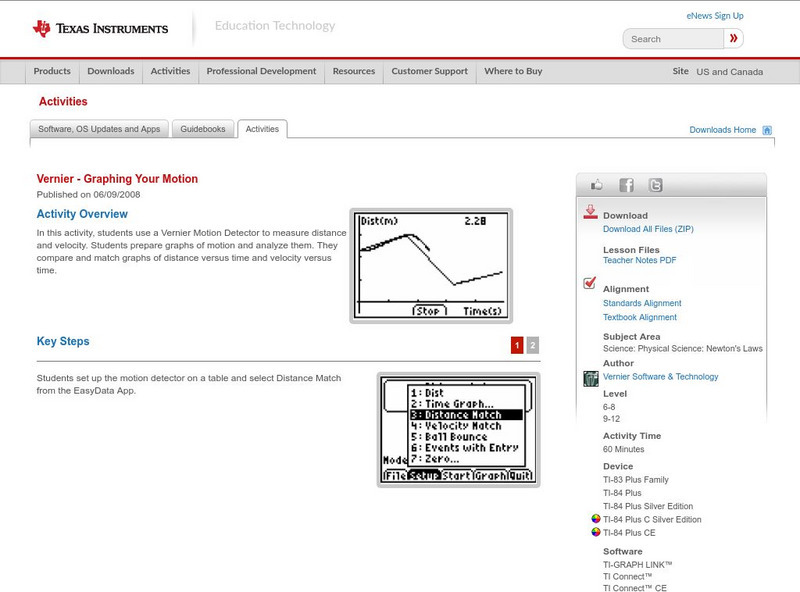
Texas Instruments: Graphing Your Motion
In this activity, students use a Motion Detector to measure distance and velocity. Students prepare graphs of motion and analyze them. They compare and match graphs of distance versus time and velocity versus time.
Other
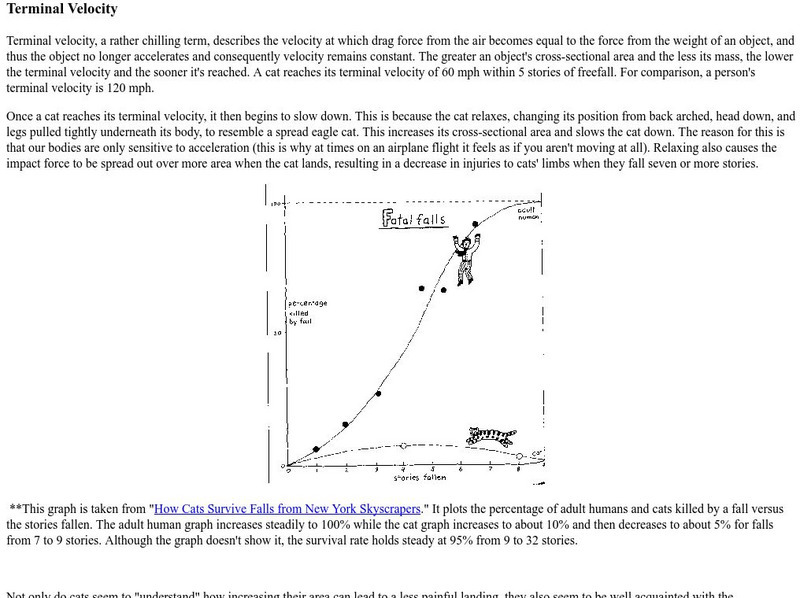
University of Alaska: Terminal Velocity
University of Alaska physics professor site explaining the concept of terminal velocity. Uses the terminal velocities of humans and cats for comparison. Site contains an interesting graph of the percent fatalities versus stories fallen.
Physics Aviary
Physics Aviary: Graphing Motion Problem Level 1
Students are finding the velocities of objects based on the position vs. time graphs they create.
Other
Easyphysics: Chapter 2 Velocity
Learners investigate velocity. Some topics examined are average velocity, distance, and displacement. The resource includes example problems with solutions, interactive graphs, and a chapter quiz.
CK-12 Foundation
Ck 12: Instantaneous Velocity
[Free Registration/Login may be required to access all resource tools.] Students explore instantaneous velocity and how to calculate it. They also learn how interpret and create position vs time graphs.
Khan Academy
Khan Academy: Instantaneous Velocity and Speed From Graphs Review
Review the key terms and skills related to analyzing motion graphs, such as finding velocity from position vs. time graphs and displacement from velocity vs. time graphs.
Khan Academy
Khan Academy: Average Velocity and Average Speed From Graphs
Practice finding average velocity or average speed from a position vs. time graph.
Khan Academy
Khan Academy: Simple Harmonic Motion: Find Speed, Velocity, Displace From Graphs
Practice finding speed, velocity, and distance traveled for an oscillator from graphs of simple harmonic motion.
Khan Academy
Khan Academy: Average Velocity and Speed in One Direction: Word Problems
Practice calculating average velocity and speed from word problems when an object moves in one direction.
Khan Academy
Khan Academy: Average Velocity and Speed With Direction Changes: Word Problems
Practice calculating average velocity and speed from word problems when an object changes directions.
Other
Institute of Physics: Practical Physics: Speed Time Graphs to Find an Equation
An illustrated example of a speed-time graph plotted with speed on the vertical axis against time on the horizontal axis.
Physics Classroom
The Physics Classroom: 1 D Kinematics: Meaning of Slope for a v T Graph
In this part of a physics lesson, examine how the actual slope value of any straight line on a velocity-time graph is the acceleration of the object.
Texas Education Agency
Texas Gateway: Changes in Motion
In this lesson, you will learn about position vs. time graphs and velocity vs. time graphs and how to use them to solve problems.
Physics Aviary
Physics Aviary: Graphing Motion Problem Level 3
Find the displacement of an object just by looking at the velocity vs. time graph. This graph will have at least one negative region and one positive region.
Texas Instruments
Texas Instruments: Graphing Motion: Instantaneous and Average Speed
Students are introduced to the calculator as a graphing tool and distinguish between average speed and instantaneous speed.
Khan Academy
Khan Academy: Change in Momentum and Speed From Force vs. Time Graphs
Practice calculating change in momentum and speed from force vs. time graphs using this four-question quiz.
Science Education Resource Center at Carleton College
Serc: Hot Wheelin' With Speed, Acceleration, and Data Graphs
In this lab, students investigate the motion of toy cars and collect data to analyze the speed of the vehicle between various points and overall speed.
BBC
Bbc: Gcse Bitesize: Motion
This lesson focuses on motion including definitions, how to calculate the change in velocity and the average acceleration, and a link to an assessment.
Physics Classroom
The Physics Classroom: 1 D Kinematics: Rightward Velocity and Acceleration
Through an animated illustration of a dot diagram and time graphs, students learn about positive velocity and positive acceleration.
Science Education Resource Center at Carleton College
Serc: Discovering Velocity Outside of the Classroom
A physics lab activity where students gather data from classmates running at different rates on a football field. They then share their gathered data and transfer it to a graphing program to ultimately calculate average velocity.
CK-12 Foundation
Ck 12 Exploration Series: Simulations: Physics: Butterfly Stroke
[Free Registration/Login Required] Learn about the relationship between velocity and position for a swimmer. Adjust the velocity of the legs, streamline, and arms to experiment with the slope of velocity in the simulation swimmer. Dig a...
CK-12 Foundation
Ck 12 Exploration Series: Simulations: Physics: Model Rocket
[Free Registration/Login Required] Learn about the relationship between position and velocity for a model rocket during launch and in free-fall. Experiment with rocket mass, rocket thrust, and rocket burn time to understand the...
Texas Education Agency
Texas Gateway: Changes in Motion
Given diagrams or scenarios, students will measure and graph changes in motion.


