Physics Classroom
Law Enforcement - Hit-and-Stick Collisions
How do police determine the speed of a car that has hit a stopped vehicle? Scholars determine the momentum of the car system both before and after a collision. They identify instances where the law of conservation of momentum appears to...
Curated OER
Speed and Distance
In this speed worksheet, learners create time vs. distance graphs to answer questions about average speed, average velocity, and acceleration. This worksheet has 3 problems to solve.
Curated OER
Velocity and Acceleration
Twelfth graders look at local speed limits and traffic controls and see if they are reasonable. They plot the displacement and time to represent velocity, develop a plan for improving the current system, and organize experimental...
Curated OER
Velocity, Acceleration, and Gravity
Students perform an experiment where a string is tied across the room. A straw is threaded onto the string, and a balloon attached to the straw. Students determine the speed of the balloon as it moves across the string. They repeat the...
Curated OER
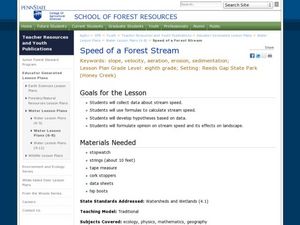
Speed of a Forest Stream
Young scholars study stream speed. In this stream speed lesson students complete an activity and formulate an opinion and study its effects.
Curated OER
Velocity
Students determine the average speed of a toy car as it travels six different distances set up by Students. Three trials are done for each distance. The only requirements is that the longest distance must be at least three times longer...
Curated OER
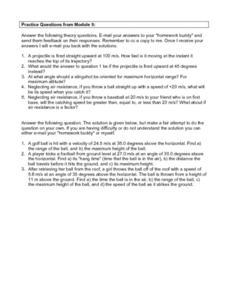
Science Questions Module 5
In this science worksheet, middle schoolers find the answers to significant questions about speed and velocity while looking for meaning with the help of others in class or online from a homework buddy.
Curated OER
What is Motion?
Prior to beginning a math or physical science lesson on motion, use this presentation to define the concepts of motion, rate, velocity, and speed. This resource lacks concrete examples but could be useful as discussion starter.
Shodor Education Foundation
Incline
Study velocity while examining graphical representations. As scholars work with the animation, they discover the effect the height of an incline has on the velocity of the biker. They make conclusions about the slope of the line in terms...
CK-12 Foundation
Bowling Alley
Sometimes it appears that a bowling ball slides down the alley rather than rolling, while other times it appears to switch rolling directions at some point. Scholars control the bowling ball size, initial rotation, initial speed, and...
Curated OER
Speeding By The Numbers
Students determine speed by running or walking a given distance and dividing the distance by the time it took them to do so. They record their average speed and compare it with the speeds of other moving objects.
Curated OER
I Feel The Need For Speed
Students are introduced to the concepts of speed, velocity, acceleration and inertia. In groups, they use the internet to research rollercoasters found in the United States and calculate their acceleration rates. They use the...
Curated OER
Physics of Roller Coasters
Students design a roller coaster and demonstrate their knowledge of Potential and Kinetic Energy. They determine the average velocity a given marble travels on their roller coaster and apply their knowledge of various measurement systems...
Curated OER
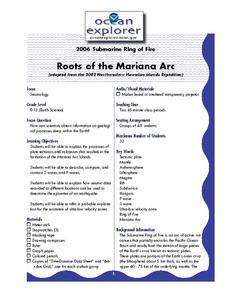
Roots of the Mariana Arc
Plumb the depths of the Submarine Ring of Fire and explore seismic waves with this lesson. Junior geologists simulate s-waves and p-waves, calculate their speeds, and then apply the data to discover the material that makes up inner...
Curated OER
Graphing Your Motion
Seventh graders investigate velocity and speed. In this Vernier Probe instructional activity, 7th graders will use probes to calculate motion, speed, and velocity of an object. They will create a graph of their collected data.
Curated OER
Position, Velocity & Acceleration vs. Time Graphs
For this graphing worksheet, students determine the speed vs. time and acceleration vs. time plots based on the velocity vs. time graph given. Students complete 2 graphs.
Curated OER
Forces, Velocity, and Mass
In this forces worksheet, students define acceleration, speed, velocity, and net force. Then students calculate net force on objects, order momentum of objects, and determine which object will acceleration the fastest. This worksheet has...
Curated OER
Speed of Sound
Students investigate the concept of velocity and apply it to the velocity of sound and measure the velocity of sound by measuring the echoes produced in a tube. They show their calculation of time and speed, and then conclude that sound...
Curated OER
Can You Calculate the Speed of Your Pet?
Students analyze the formula for speed and velocity. They explore and demonstrate how to calculate the speed of wind up toy pets, average the speeds and identify the correct units of measure of speed.
NTTI
Vectors: Traveling, But in What Direction
High schoolers watch a video of real-world situations regarding speed, direction, velocity, force, etc. and answer questions while viewing. They then practice drawing and using vectors to solve more real-world problems.
Curated OER
Glacier Dynamics
Students create flubber glaciers. In this glacier dynamics lesson, students experiment factors that may affect glacier speed. Factors include slope, ice temperature, and basal conditions. Students develop hypothesis, conduct experiment,...
Curated OER
Straight Line Motion with a Stomper
Learners explore average speed, and graph distances and time. In this speed and velocity lesson students complete a lab then calculate distances, acceleration and velocity and graph the data.
Curated OER
Acceleration
In this acceleration worksheet, students solve 14 problems including finding work done on an object, the speed of an object, the distance traveled and the acceleration.
Curated OER
MOTION IN A CIRCLE
Young scholars explore uniform circular motion, and the relation of its frequency of N revolutions/sec with the peripheral velocity v and with the rotation period T, and the "centripetal acceleration" of an object.


