Vision Learning
Visionlearning: Statistics: Using Mean, Median, and Standard Deviation
An introduction to recognizing trends and relationships in data through descriptive statistics.
Illustrative Mathematics
Illustrative Mathematics: S Id Sat Scores
Students will find solutions for a series of questions based on the assumption that SAT mathematics scores for a particular year are approximately normally distributed with a mean of 510 and a standard deviation of 100. Explanation and...
Illustrative Mathematics
Illustrative Mathematics: Measuring Variability in a Data Set
The purpose of this student task is to develop understanding of standard deviation. Aligns with S-ID.A.2 and S-ID.A.3.
University of Illinois
University of Illinois: Mste: How Much Do Baseball Players Really Make?
An interesting real-world use of statistical variance and standard deviation to help dispell the common perception that all major league baseball players are paid millions of dollars and are not worth it. The lesson plan gives specific...
National Council of Teachers of Mathematics
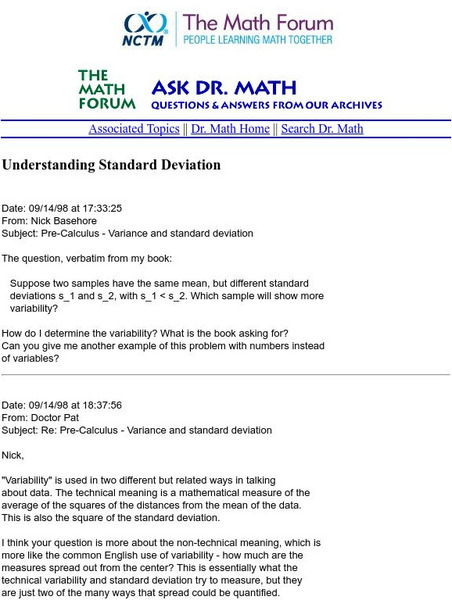
The Math Forum: Understanding Standard Deviation
MathForum answers a question on variance and standard deviation.
BBC
Bbc: Standard Deviation
A demonstration of how to find the standard deviation of a set of data. Several examples and a practice test are offered.
University of Illinois
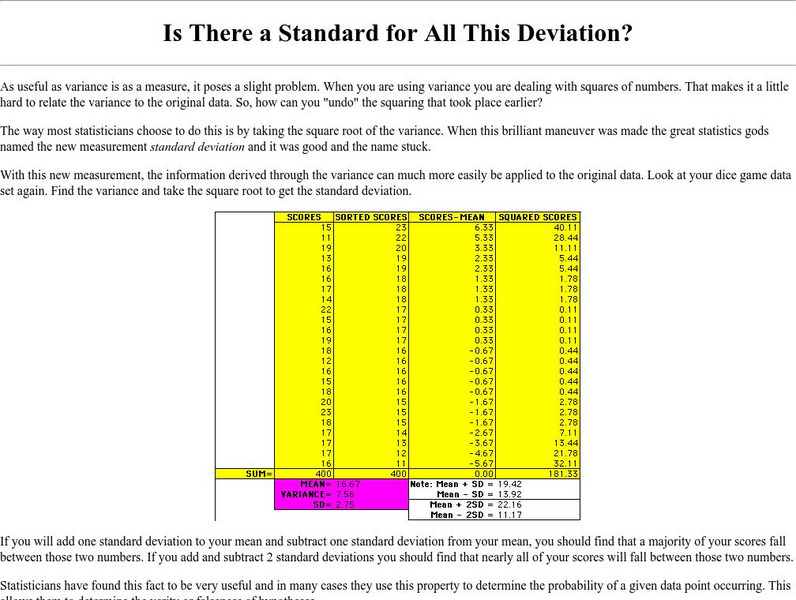
University of Illinois: Mste: Is There a Standard for All This Deviation?
Site contains information on the statistical term standard deviation. It gives a definition and shows how to calculate it. It has a link to information on the absolute value of a deviation and how the topics are related.
Texas Instruments
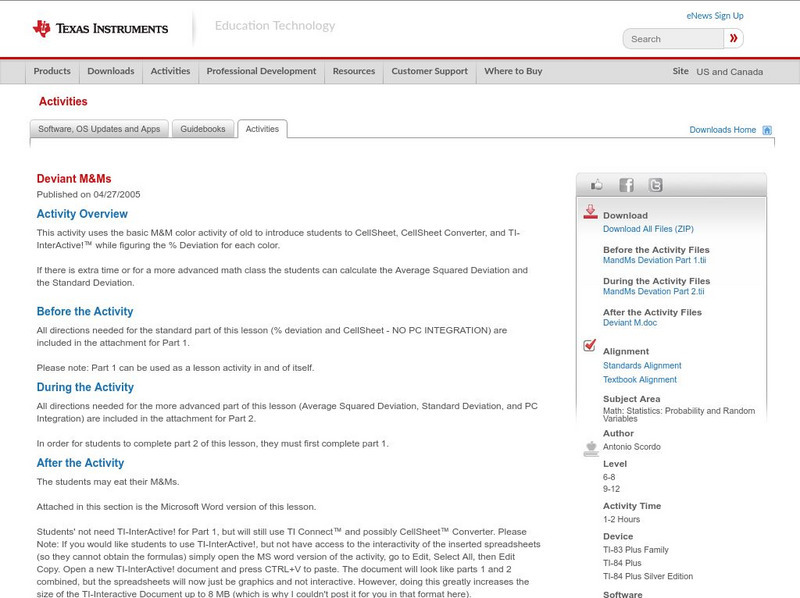
Texas Instruments: Deviant M&ms
This activity uses the basic M&M color activity of old to introduce students to CellSheet, CellSheet Converter, and TI-InterActive! while figuring the % Deviation for each color. If there is extra time or for a more advanced math...
Khan Academy
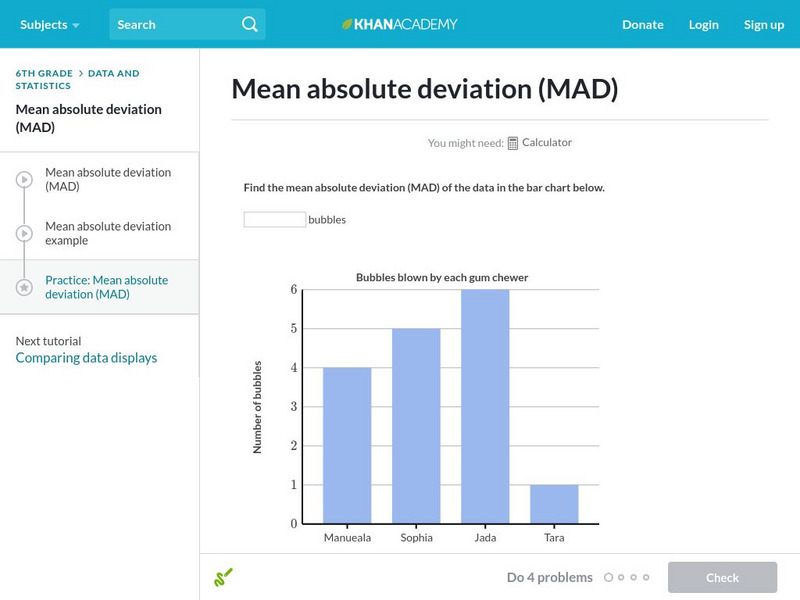
Khan Academy: Mean Absolute Deviation (Mad)
Practice calculating the mean absolute deviation.
Other
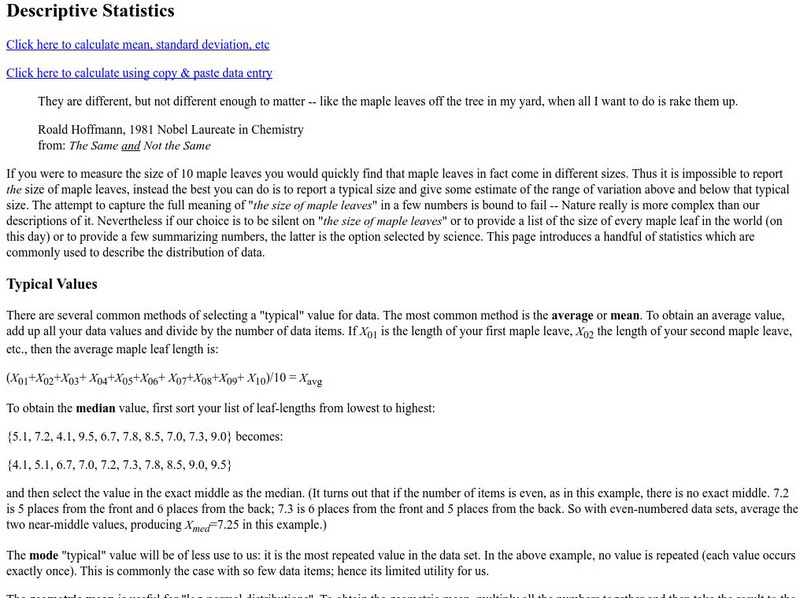
Descriptive Statistics
Very complete explanation of mean, standard deviation, etc. including an online calcluator for these statistics.
Missouri State University
Missouri State University: Introductory Statistics: Statistics
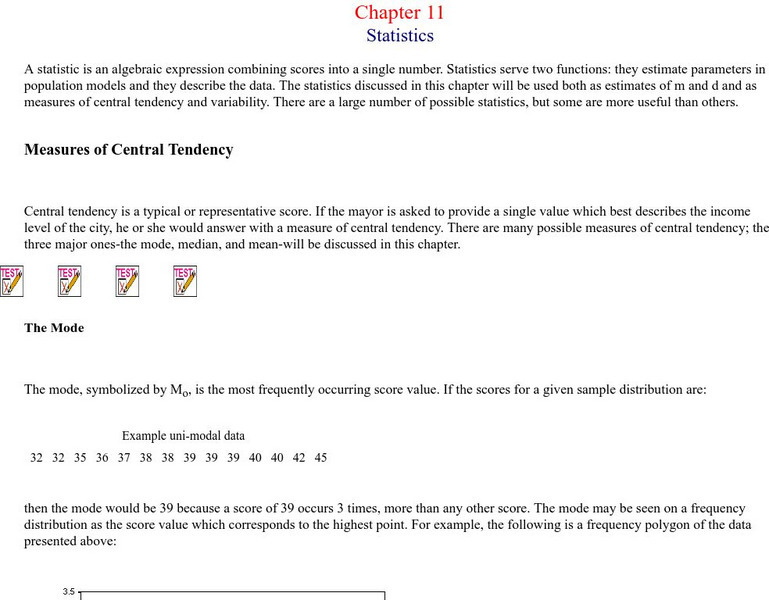
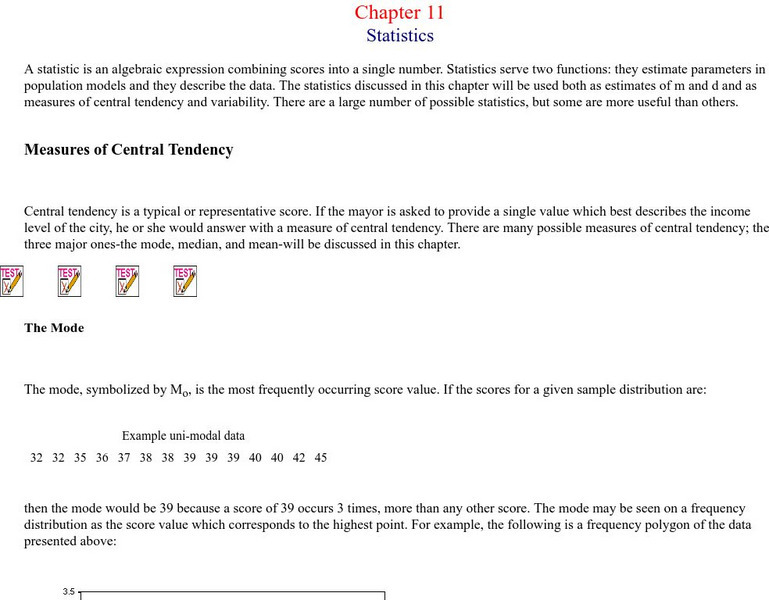
This is an excellent resource on what the science of statistics involves. There are all kinds of definitions, examples, graphs, and charts to learn from. The topics covered include: mode, mean, median, skewed distributions and measures...
Missouri State University
Missouri State University: Introductory Statistics: The Normal Curve
Provides lengthy explanations of the measures of central tendencies - mean, mode, and median - and the measures of variability - range, variance, standard deviation - are given here. Graphs of interesting "side items" are presented as...
Missouri State University
Missouri State U.: Statistics: Measures of Central Tendency and Variability
Provides lengthy explanations of the measures of central tendency - mean, mode, and median - and the measures of variability - range, variance, standard deviation. Graphs of interesting examples are presented as well, skewed...
Calculator Soup
Calculator Soup: Descriptive Statistics Calculator
This is a statistics calculator; enter a data set and hit calculate. Descriptive statistics summarize certain aspects of a data set or a population using numeric calculations. Examples of descriptive statistics include: mean, average,...
Curated OER
Image for Standard Deviation
A quick definition and overview of statistical standard deviation. A piece of clip art is provided to aid in understanding, and links are given for related terms.
Illustrative Mathematics
Illustrative Mathematics: S Id.4 Should We Send Out a Certificate?
Should Fred receive a certificate for scoring in the top 2.5% of a statewide standardized test? Given the test scores for a large population and the mean and standard deviation, students will decide if Fred's score is good enough....
Illustrative Mathematics
Illustrative Mathematics: S Id.4 Do You Fit in This Car?
Students are tasked with solving a common issue for automobile manufacturers that require the students to use normal distribution as a model for data distribution. They will also use mean and standard deviation to figure out the problem....
Annenberg Foundation
Annenberg Learner: Against All Odds: Random Variables
Video presentation on the probability of independent events, covering related topics: multiplication rule, random variable, and mean and standard deviation. [28:41]
City University of New York
Measures of Variability
Explanation and examples of variance and standard deviation. Helpful charts and formulas are provided.
Texas Instruments
Texas Instruments: How Close Is Close?
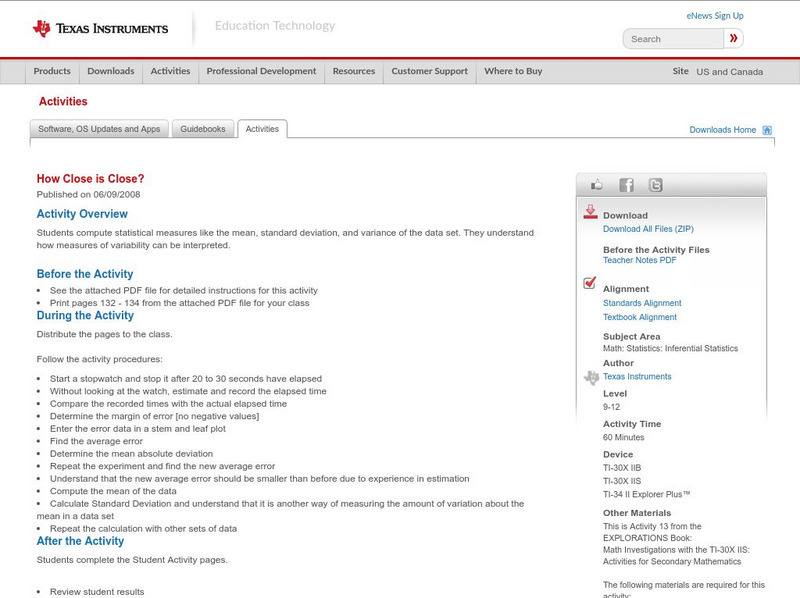
In this activity, students compute statistical measures like the mean, standard deviation, and variance of the data set. They understand how measures of variability can be interpreted.
Texas Instruments
Texas Instruments: Simulation of Sampling Distributions
This set contains questions about simulating sampling distributions. Students see graphs of simulated distributions enabling them to reach conclusions about mean, shape, and standard deviation.
Texas Instruments
Texas Instruments: Probability as Relative Frequency
In this activity, students use simulation to justify the concept of the Law of Large Numbers. They understand that as the sample size increases, the relative frequency of which an event occurs approaches the probability of that event...
Science Education Resource Center at Carleton College
Serc: Nitrate Levels in the Rock Creek Park Watershed: Variability
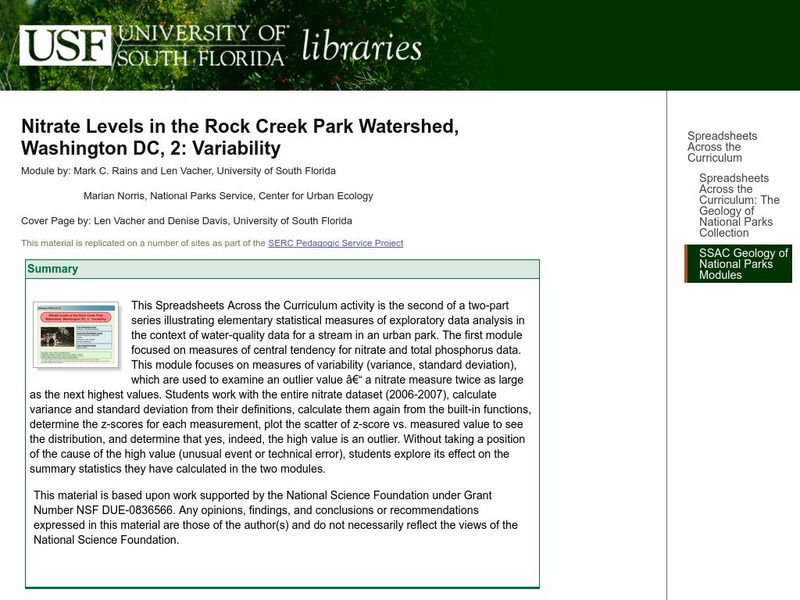
Learning module focuses on measures of variability such as range, variance, and standard deviation which are used to examine nitrate levels and water quality.
Other
Online Statistics Education: Measures of Variability
Learning Objectives cover the areas of the Measures of Variability. Explanations are given for: variability, range, interquartile range, variance, and standard deviation. Examples and quizzes are also provided.
Other popular searches
- Standard Deviation and Mean
- Mean Standard Deviation
- Math Standard Deviation
- Standard Deviation Z Score
- Chemistry Standard Deviation
- Standard Deviation Computer
- Mean, Standard Deviation
- Standard Deviation Madekine
- Standard Deviation Made Kine


