McGraw Hill
Glencoe: Online Study Tool: Quiz on Measures of Variability
Students demonstrate advanced mathematics skills with this online quiz. The questions check understanding on measures of variability. Topics include variance, standard deviation, and frequency tables.
Khan Academy
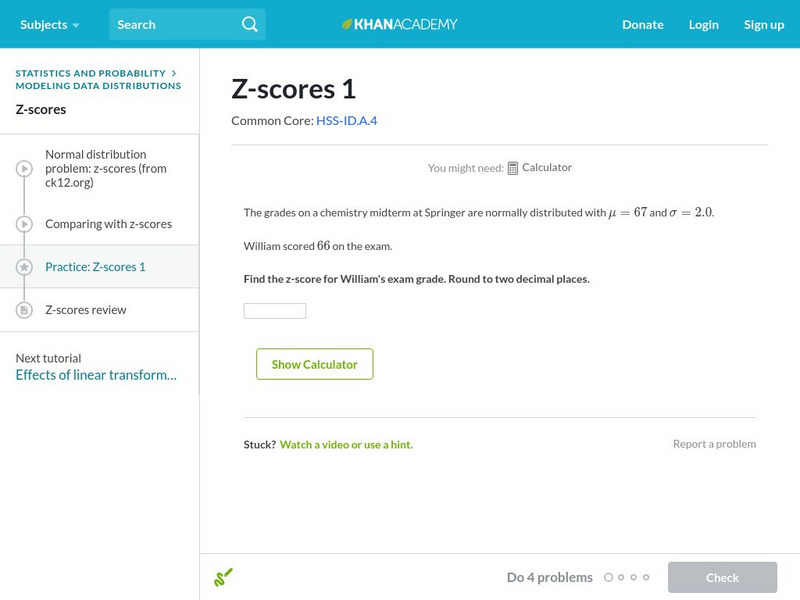
Khan Academy: Z Scores 1
Find the z-score of a particular measurement given the mean and standard deviation. Students receive immediate feedback and have the opportunity to try questions repeatedly, watch a video or receive hints.
Texas Instruments
Texas Instruments: Spread Out #1
This exploration uses baseball's slugging average to explore variance and standard deviation.
Other
Magoosh: Statistics Fundamentals
An online course on the fundamentals of statistics including video lessons in Mean, Median, and Mode; Weighted Averages; Quartiles and Boxplots; Range and Standard Deviation; Normal Distribution; Z-scores; Intro to Inferential...
Shodor Education Foundation
Shodor Interactivate: Measures
Enter data and view the mean, median, variance, and standard deviation of the data set.
Shodor Education Foundation
Shodor Interactivate: Skew Distribution
Change the median and standard deviation of an automatically generated normal distribution to create a skewed distribution, allowing you to observe properties like what it means for the mean, median, and mode to be different.
Shodor Education Foundation
Shodor Interactivate: Normal Distribution
Change the standard deviation of an automatically generated normal distribution to create a new histogram. Observe how well the histogram fits the curve, and how areas under the curve correspond to the number of trials.
CK-12 Foundation
Ck 12: Algebra Ii: 5.5 Sampling Variability
This section explores the concept of sampling variability in the sample proportion. It will address the effect on the mean and standard deviation of a sample distribution as the sampling size changes.
Other
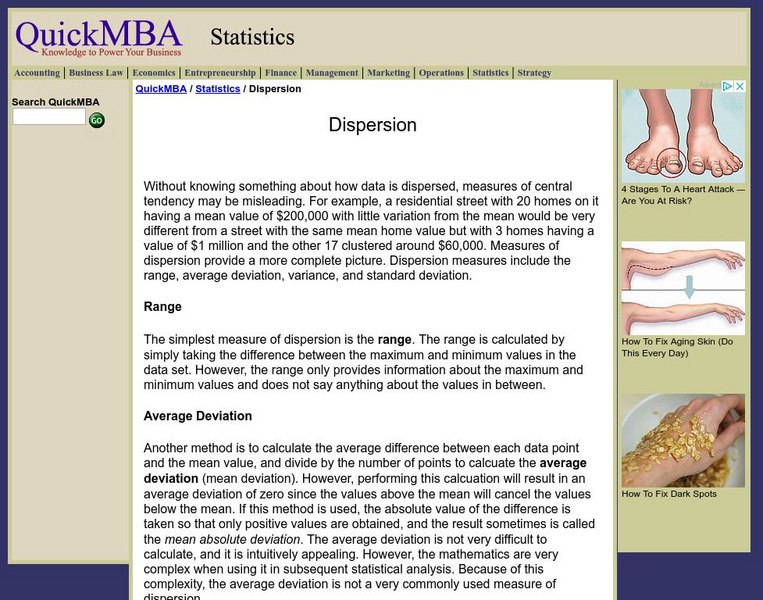
Dispersion
This site discusses the range, average deviation, variance, and standard deviation, as well as their relation to dispersion.
Other
James Wright: Measures of Central Tendency
This site looks at measures of central tendency and dispersion. Discussed are topics such as standard deviation, mean, median, and mode.
University of Illinois
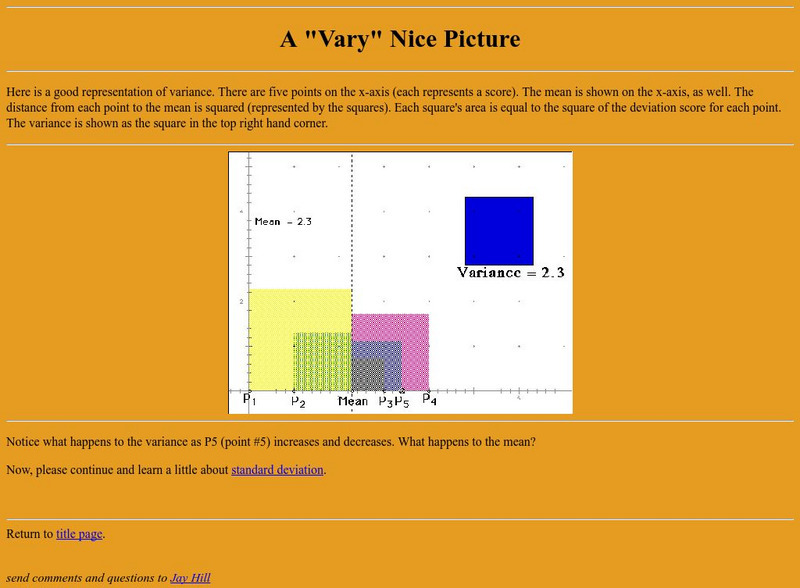
University of Illinois: A "Vary" Nice Picture
Site from the University of Illinois contains a graphical representation of variance. A follow-up question for the user and a link to standard deviation - a related statistical topic - are also provided.
Other
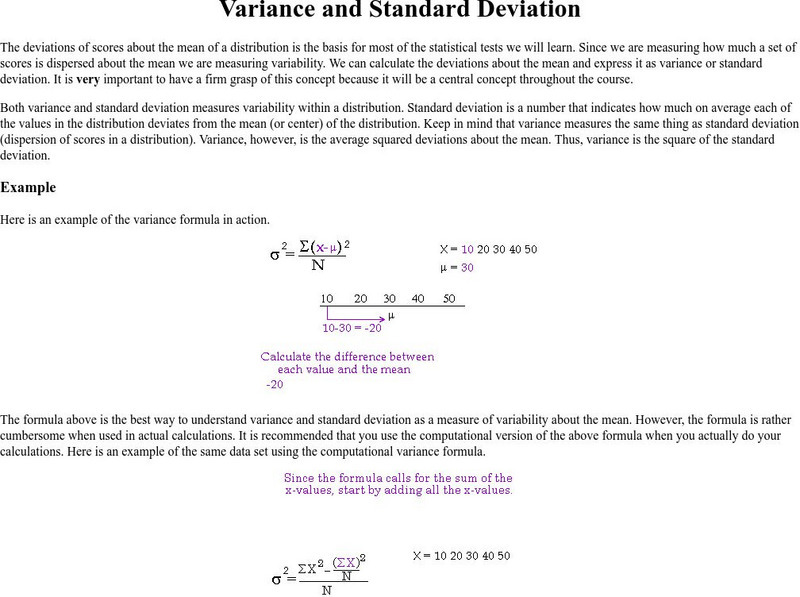
Fayetteville State Univ.: Variance & Standard Deviation
Quick definitions of these statistical terms are provided, then followed by an example covering both of them. This page is part of a larger series which gives simple explanations of common, useful statistical concepts.
Curated OER
Computing Mean, Variance and Standard Deviation
Page centered around a computer program to determine mean, variance, and standard deviation.
United Nations
Unesco: Measures of Dispersion
Explanation of the different measures of dispersion (range, interquartile range, and standard deviation) are given.
Other
Meta Calculator: Statistics Calculator
A web-based statistics calculator to find mean, median, standard deviation, variance and ranges.
Calculator Soup
Calculator Soup: Statistics Calculator
Calculate basic summary statistics for a sample or population data set including minimum, maximum, range, sum, count, mean, median, mode, standard deviation and variance.
Calculator Soup
Calculator Soup: Variance Calculator
Variance is a measure of dispersion of data points from the mean. Low variance indicates that data points are generally similar and do not vary widely from the mean. High variance indicates that data values have greater variability and...
CK-12 Foundation
Ck 12: Using Probability to Make Decisions
Use this Common Core Math Standards Browser to search specific math concepts and their corresponding standards. This page focuses on Using Probability to Make Decisions. Click on the links to find lessons, activities, videos, and study...
CK-12 Foundation
Ck 12: Statistics: Measures of Spread/dispersion Grade 8
[Free Registration/Login may be required to access all resource tools.] Understanding the mean and statistical deviations.
Other
Stat Soft: Statistics Glossary
Dozens of statistical terms are defined and illustrated in this glossary.
Science Museum, London
Making the Modern World: Defining Mental Illness
Defining mental illness takes into account several deviant behaviors. Find out what psychologists use to determine mental disorders.
University of Illinois
University of Illinois: Spreading It Thick
Resource contains the definition for variance. It also shows students how to calculate the variance. There is a link to a bar graph that displays variance for the data example.
Texas Instruments
Texas Instruments: Using Derive
In this activity, students use the Derive software to solve trigonometric equations, expressions with exponentials, and log equations. They also determine the equation of tangent and normal of a function; evaluate integrals, find area...
Texas Instruments
Texas Instruments: Statistics for Math B
Students will determine the mean, median, mode and standard deviation of collected data. They will make a frequency histogram of the grouped data, both on graph paper, and on the TI 83+.
Other popular searches
- Standard Deviation and Mean
- Mean Standard Deviation
- Math Standard Deviation
- Standard Deviation Z Score
- Chemistry Standard Deviation
- Standard Deviation Computer
- Mean, Standard Deviation
- Standard Deviation Madekine
- Standard Deviation Made Kine


