Curated OER
Data Analysis
Students examine techniques to represent data. In this data analysis lesson plan, students read about various ways to represent data, such as a stem and leaf diagram and calculating standard deviation. Students complete data analysis...
Curated OER
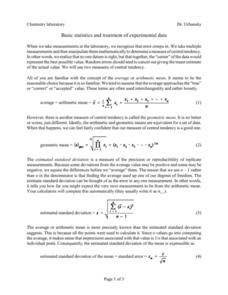
Basic Stats
In this chemistry worksheet, students focus upon the concepts of mean and standard deviation and how it is used in the laboratory to interpret data.
Illustrative Mathematics
Should We Send Out a Certificate?
Fred thinks his test score is high enough to earn him a certificate. Given the mean and standard deviation, use properties of normal distributions to calculate Fred's percentile ranking and see if he is right. Consider having your class...
American Statistical Association
Step into Statastics
Class members study the size of classmates' feet and perform a statistical analysis of their data. They solve for central tendencies, quartiles, and spread for the entire group as well as subgroups. They then write a conclusion based on...
Statistics Education Web
It’s Elemental! Sampling from the Periodic Table
How random is random? Demonstrate the different random sampling methods using a hands-on activity. Pupils use various sampling techniques to choose a random sample of elements from the periodic table. They use the different samples to...
Curated OER
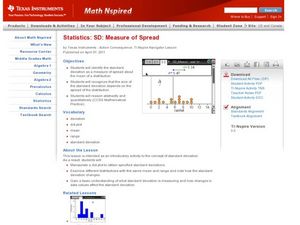
Measure of Spread
Students identify the standard deviation. In this statistics lesson, students find the mean distribution and calculate the percent of deviation from the mean. They observe this change on the Ti calculator.
Curated OER
Using Computers for Statistical Analysis of Weather
Students use temperature, cloud cover and other weather data from the S'COOL website to statistically analyze weather around the country. They use computers to calculate and graph standard deviations, means and modes of the weather...
Curated OER
Chapter 5 Review
In this statistics worksheet, learners solve and complete 10 different types of problems. First, they determine the probability of various actions described. Then, students describe an appropriate model for the number described and...
Teach Engineering
Measuring Surface Tension
How do you measure surface tension? The fifth installment of a nine-part series is an experiment where young scientists use tubes of different sizes to measure surface tension. They calculate the average and standard deviation of the...
Virginia Department of Education
Normal Distributions
Pupils work to find probabilities by using areas under the normal curve. Groups work to calculate z-scores and solve real-world problems using the empirical rule or tables.
American Statistical Association
What is the Probability of “Pigging Out”
Learners apply their understanding of luck to a probability experiment. They play a game of Pass the Pigs to determine the probability of a specific outcome. Using analysis for their data, pupils declare the measures of center, dot...
Curated OER
Statistical Process Control
Students brainstorm items they have that use memory and view Statistical Process Control PowerPoint presentation. They complete Statistical Process Control Simulation/experiment then find the average, range and standard deviation in...
Howard Hughes Medical Institute
Sampling and Normal Distribution
Young scientists learn about sampling and normal distributions through data analysis. A worksheet guides them to better understanding and synthesis of knowledge.
Florida International University
Counting FishStix
How do we count the fish in the ocean? An engaging lesson models how to estimate fish populations with observational surveys. Class members begin by studying the behavior of fish on the coral reef in the oceans. They then become the fish...
Howard Hughes Medical Institute
Spreadsheet Tutorial 4: t-Test
The t-test tutorial will fit your needs to a T. After calculating the mean, sum of squares, standard deviation, and variance of two data sets on a spreadsheet, scholars learn to calculate the t-values. They then learn to use the TTEST...
Illustrative Mathematics
SAT Scores
If you earned a score of 610 on the math portion of the SAT, what would be your percentile ranking? Given the mean and standard deviation of normally distributed data, find the probability of getting a particular score, or that your...
Illustrative Mathematics
Do You Fit In This Car?
A short activity that focuses on the normal distribution as a model for data distribution. Using given means and standard deviations, your budding statisticians can use statistical tables, calculators, or other statistical software to...
Illustrative Mathematics
Accuracy of Carbon 14 Dating I
Here is an activity that is intended to highlight a very important issue about precision in reporting and understanding statements in a realistic scientific context. Discuss different ways of reporting the half life of Carbon 14 using...
Curated OER
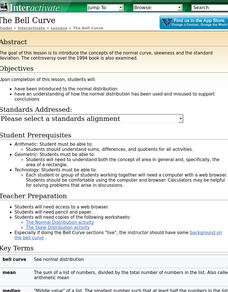
The Bell Curve
Students are introduced to the normal distribution and examine the bell curve controversy.
Curated OER
How Far is Far?
Students calculate the standard deviation of data. In this statistics lesson, students collect data, plot it and analyze it. They identify the mean, median and range of their data.
Curated OER
Scrabble
In this frequency learning exercise, students use the standard rules for Scrabble to find the abbreviations used on the board. Then, the determine the frequency as stated in the chart shown to represent the correct number of letter tiles.
Virginia Department of Education
Exploring Statistics
Collect and analyze data to find out something interesting about classmates. Groups devise a statistical question and collect data from their group members. Individuals then create a display of their data and calculate descriptive...
College Board
Why Variances Add - And Why It Matters
Why is adding variance important? A lesson outline defines a variance theorem and how it affects the data statistics. The instruction shows scholars the importance of considering the variance of data and why it requires independence.
American Statistical Association
Tell it Like it is!
Scholars apply prior knowledge of statistics to write a conclusion. They summarize using correct academic language and tell the story of the data.
Other popular searches
- Standard Deviation and Mean
- Mean Standard Deviation
- Math Standard Deviation
- Standard Deviation Z Score
- Chemistry Standard Deviation
- Standard Deviation Computer
- Mean, Standard Deviation
- Standard Deviation Madekine
- Standard Deviation Made Kine


