Calculator Soup
Calculator Soup: Variance Calculator
Variance is a measure of dispersion of data points from the mean. Low variance indicates that data points are generally similar and do not vary widely from the mean. High variance indicates that data values have greater variability and...
Other
Meta Calculator: Statistics Calculator
A web-based statistics calculator to find mean, median, standard deviation, variance and ranges.
Calculator Soup
Calculator Soup: Statistics Calculator
Calculate basic summary statistics for a sample or population data set including minimum, maximum, range, sum, count, mean, median, mode, standard deviation and variance.
CK-12 Foundation
Ck 12: Statistics: Measures of Spread/dispersion Grade 8
[Free Registration/Login may be required to access all resource tools.] Understanding the mean and statistical deviations.
CK-12 Foundation
Ck 12: Using Probability to Make Decisions
Use this Common Core Math Standards Browser to search specific math concepts and their corresponding standards. This page focuses on Using Probability to Make Decisions. Click on the links to find lessons, activities, videos, and study...
Texas A&M University
Wtamu Virtual Math Lab: Beginning Agebra: Central Tendencies
A tutorial to understand the three central tendencies and how to find them, as well as the standard deviation of values. Offers a discussion and practice problems.
Khan Academy
Khan Academy: Discrete Random Variables: Expected Value
Compute the expected value given a set of outcomes, probabilities, and payoffs. Students receive immediate feedback and have the opportunity to try questions repeatedly or receive hints.
CK-12 Foundation
Ck 12: Algebra Ii: 6.3 Z Scores
See how Z-scores are related to the Empirical Rule from the standpoint of being a method of evaluating how extreme a particular value is in a given set.
Other
Stat Soft: Statistics Glossary
Dozens of statistical terms are defined and illustrated in this glossary.
Texas Instruments
Texas Instruments: Statistics for Math B
Students will determine the mean, median, mode and standard deviation of collected data. They will make a frequency histogram of the grouped data, both on graph paper, and on the TI 83+.
CK-12 Foundation
Ck 12: Statistics: Central Limit Theorem
[Free Registration/Login may be required to access all resource tools.] Introduces students to the Central Limit Theorem. Students will learn about the Central Limit Theorem and calculate a sampling distribution using the mean and...
Khan Academy
Khan Academy: Normal Distributions Review
Normal distributions come up time and time again in statistics. A normal distribution has some interesting properties: it has a bell shape, the mean and median are equal, and 68% of the data falls within 1 standard deviation.
Khan Academy
Khan Academy: Sampling Distribution of a Sample Proportion Example
Presents a problem that is similar to what might be on an AP Statistics exam. Walks students through each step for solving it and students input answers to questions along the way.
Khan Academy
Khan Academy: Expected Value With Calculated Probabilities
Find expected value based on calculated probabilities. Students receive immediate feedback and have the opportunity to try questions repeatedly, watch a video or receive hints.
Oswego City School District
Regents Exam Prep Center: Statistical Studies, Central Tendency, and Dispersion
The mathematics tutorial investigates statistical studies, central tendency, and dispersion. The lesson consists of class notes, calculator tips, examples, and practice problems with solutions. The teacher resource includes an activity...
University of Illinois
University of Illinois: Introduction to Descriptive Statistics
A series of explanations of statistics terms based on the statistics from a dice game.
Math Is Fun
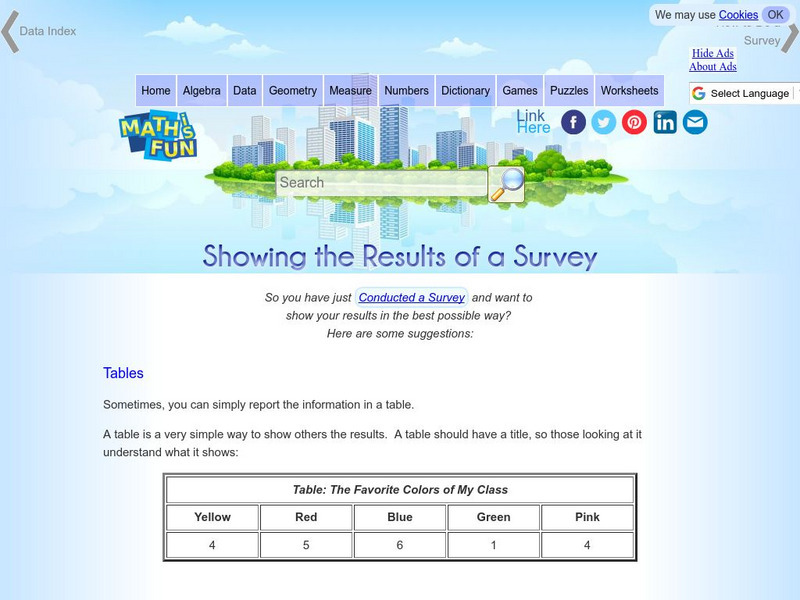
Math Is Fun: Showing the Results of a Survey
A variety of ways to display the results of a survey are listed, including tables, statistics and different types of graphs.
Illustrative Mathematics
Illustrative Mathematics: 7.sp.3,4 College Athletes
Below are the heights of the players on the University of Maryland women's basketball team for the 2012-2013 season and the heights of the players on the women's field hockey team for the 2012 season. (Accessed at...


