Illustrative Mathematics
SAT Scores
If you earned a score of 610 on the math portion of the SAT, what would be your percentile ranking? Given the mean and standard deviation of normally distributed data, find the probability of getting a particular score, or that your...
Illustrative Mathematics
Do You Fit In This Car?
A short activity that focuses on the normal distribution as a model for data distribution. Using given means and standard deviations, your budding statisticians can use statistical tables, calculators, or other statistical software to...
Illustrative Mathematics
Accuracy of Carbon 14 Dating I
Here is an activity that is intended to highlight a very important issue about precision in reporting and understanding statements in a realistic scientific context. Discuss different ways of reporting the half life of Carbon 14 using...
Curated OER
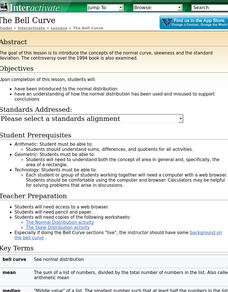
The Bell Curve
Students are introduced to the normal distribution and examine the bell curve controversy.
Curated OER
A RealSim Surface Look at Descriptive Statistics
Students explore the concepts of mean and variance. They observe properties of materials to their basic atomic or molecular structure. Students use spreadsheet software to record, tabulate and analyze collected information.
Curated OER
How Far is Far?
Students calculate the standard deviation of data. In this statistics lesson, students collect data, plot it and analyze it. They identify the mean, median and range of their data.
Virginia Department of Education
Exploring Statistics
Collect and analyze data to find out something interesting about classmates. Groups devise a statistical question and collect data from their group members. Individuals then create a display of their data and calculate descriptive...
Statistics Education Web
It Creeps. It Crawls. Watch Out For The Blob!
How do you find the area of an irregular shape? Class members calculate the area of an irregular shape by finding the area of a random sampling of the shape. Individuals then utilize a confidence interval to improve accuracy and use a...
Mathematics Vision Project
Module 9: Statistics
All disciplines use data! A seven-lesson unit teaches learners the basics of analyzing all types of data. The unit begins with a study of the shape of data displays and the analysis of a normal distribution. Later lessons discuss the...
Fort Bend Independent School District
Data Analysis - AP Statistics
What better way to study survey design than to design your own survey! Bring a versatile data analysis project to your AP Statistics class, and encourage them to apply the practices from their instructions to a real-world survey project.
American Statistical Association
Tell it Like it is!
Scholars apply prior knowledge of statistics to write a conclusion. They summarize using correct academic language and tell the story of the data.
Curated OER
Exercise Those Statistics!
Students participate in various activities, measuring their pulse rates and recording the data. They analyze the statistical concepts of mean, median, mode, and histograms using the data from the cardiovascular activities.
Curated OER
Are Taxes "Normal?"
Students explore the concept of normal distribution. In this normal distribution lesson plan, students find the normal distribution of taxes in the 50 US states. Students make histograms, frequency tables, and find the mean and median of...
EngageNY
Normal Distributions (part 2)
From z-scores to probability. Learners put together the concepts from the previous lessons to determine the probability of a given range of outcomes. They make predictions and interpret them in the context of the problem.
Curated OER
Meaning of Alpha
pupils define the alpha level. In this statistics lesson, students identify what makes the "null rejected" and discuss the data surrounding the null. They observe the meaning of alpha as it relates to the bell curve.
Curated OER
Sampling Distribution and Estimators Section 6.4
In this distribution worksheet, students examine given situations, determine the probability of an event, identify the standard deviation, and find a specified percentile and quartiles. Five probability story problems are available on...
Curated OER
Statistics: Final Exam Review
In this statistics and probability worksheet, students are provided with a review of the final exam in statistics. The three page worksheet contains a combination of six multiple choice and free response questions. Answers are not...
CCSS Math Activities
Smarter Balanced Sample Items: High School Math – Target P
Learn how to show data in varied ways. A PowerPoint presentation provides six questions from the high school SBAC Claim 1 Target P item specifications. It covers creating data representations, interpreting and comparing data, and...
NOAA
Investigating Sea Level Using Real Data
The news reports on rising sea level, but how do scientists measure this rise? Scholars use NOAA data including maps, apps, and images to work through five levels of activities related to sea level. Each level in the series adds a new...
College Board
2012 AP® Statistics Free-Response Questions
There's no better way to prepare your class for the AP® test format than previous exams. Instructors and scholars use the 2012 AP® Statistics free-response questions to familiarize themselves with the test. Topics covered in the exam...
College Board
2010 AP® Statistics Free-Response Questions
Familiarity with the AP® exam is highly beneficial for test-takers. Scholars use the 2010 AP® Statistics free-response questions familiarize themselves with the test content and format. Studies and experiments, linear regression,...
College Board
2007 AP® Statistics Free-Response Questions
Knowing the questions ahead of time should be beneficial. Free-response questions released from the 2007 AP® Statistics tests provide teachers and pupils insight into the types of questions on the exam. The six open-ended questions show...
College Board
2006 AP® Statistics Free-Response Questions Form B
Test a significant review of statistical questions. The resource provides pupils and teachers with insight into the way the exam assesses statistical concepts. Half of the released questions from the 2006 AP® Statistics Form B questions...
College Board
2004 AP® Statistics Free-Response Questions Form B
Over the years, data analysis has been important. Looking back to the 2004 AP® Statistics Form B free-response questions, pupils and teachers see the importance of analysis of data sets. The six questions contain analysis of data on...


