Curated OER
How Fast Is Your Car?
Eighth graders discover the relationship between speed, distance, and time. They calculate speed and represent their data graphically. They, in groups, design a ramp for their matchbox car. The goal is to see who's ramp produces the...
Curated OER
Ratio Basketball
Middle schoolers, in teams of four, practice shooting free throws while mentally converting the ratio of shots made to those thrown into a percent. They chart and record the ratio, decimal and actual percentage earned after each round.
Curated OER
The Good, The Bad, The Ugly
Sixth graders examine the causes of the stock market crash of 1929. In this integrated math/history unit on the stock market, 6th graders study, research, and read stocks, visit a local bank, and create a PowerPoint to show the finished...
Curated OER
Jambalaya's Restaurant
Learners use a menu and recipes to work on adding, subtracting, and percentages. They are given they weekly circulators, advertisements, or actual products and students practice figuring out sales tax. Learners figure slaes tax and tip...
Curated OER
Geometric Fractals and the Chaos Game
Learners define fractals and patterns. They explore how a seemingly random process can result in a pattern. Students practice probability and fractions skills by playing the chaos game online.
Curated OER
How Has Math Evolved?
Eighth graders pick a topic or person to research related to the history of mathematics. They brainstorm and create a concept map, using the multimedia software inspiration, about what they are researching and want to examine. They then...
Curated OER
Buggin' Out (Identifying and Adding Amounts of Money)
Students explore consumer math by participating in estimate exercises. In this currency instructional activity, students identify and define each piece of U.S. currency and their value to the monetary system. Students complete several...
Curated OER
Numbers Beyond Reason!
Fourth graders use the story of the discovery of irrational numbers to explore the different classes of numbers, the different ways in which numbers may be represented, and how to classify different numbers into their particular class.
Curated OER
Hollywood's Top Ten
Young scholars gather data on top 10 highest grossing movies, and make a bar graph and a pictogram.
Curated OER
A Trip to Colonial Virginia
Students consider prices while planning a trip to Colonial Virginia. In this budgeting lesson, students construct an itinerary of events for a vacation. Students are responsible for working within the approved budget.
Pennsylvania Department of Education
Freckle Face
Students collect and record data. In this early data analysis lesson, students gather data about their partners face. As a class, the students use tally marks and pictographs to record the data and answer question about the information...
Curated OER
Cube Combinations
Second graders, given 5 number cubes, roll the cubes and record the data.
Curated OER
Comparing Negative Fractions, Mixed Numbers and Decimal
Seventh graders explore the concept of negative rational numbers. For this negative rational numbers lesson, 7th graders discuss similarities between positive and negative rational numbers. Students predict what rational numbers lie...
Pennsylvania Department of Education
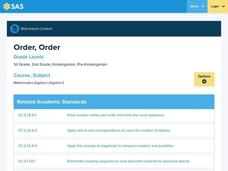
Order, Order
Students use pictures to identify items as ordinal numbers. In this ordinal numbers lesson plan, students use the words "before" and "after" to identify the pictures as well.
Curated OER
Fraction Clue Box
Students distinguish between proper and improper fractions. They create a "Character Clue Box" that represents a fraction. Fractions are picked from a hat and then groups go outside and search for items that represent their fraction....
Curated OER
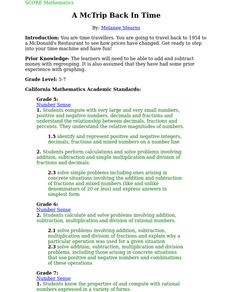
A McTrip Back In Time
Students pretend they are time-travellers and travel back to 1954 to a McDonald's Restaurant to see how prices have changed. They need to add and subtract money with regrouping.
Curated OER
Family Cookbook
Second graders, in groups, produce a Family Cookbook by bringing recipes from home.
Curated OER
Using Inequalities to Problem Solve
Students explore inequalities. For this Algebra I lesson, students solve and graph linear inequalities involving addition, subtraction, multiplication, or division. Students use inequalities to solve and graph real-world problems.
Curated OER
Graph a Panther's Diet
Pupils examine the diet of panthers. In this interpreting data instructional activity, students collect data on the panther's diet and chart the data in bar and pie graphs.
Curated OER
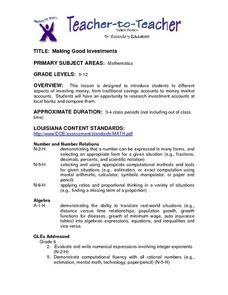
Making Good Investments
Students compare different aspects of investing money from traditional savings accounts to money market accounts. They research investment accounts at local banks and compare them.
Curated OER
Equivalent Mixed Numbers
Fifth graders use various internet sites to complete math programs where they identify different representations of mixed numbers. In this mixed numbers lesson plan, 5th graders practice math before hand and then go on the computers in...
Curated OER
The Home Stretch
Students read the novel Stone Fox by John Reynold Gardiner. Using Lego RCX units, students build and program sleds to re-enact the "home stretch" of the National Dog Sled Race.
Curated OER
Number Books
Students construct a book to illustrate number concepts. They write their numbers on a sheet of paper. Students in grade 1 discuss counting to 100 by different numbers. Pupils in grades (2-4) write basic addition or subtraction story...
Helping with Math
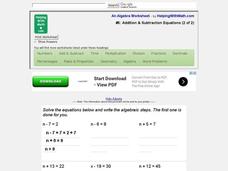
#6: Addition and Subtraction Equations (2 of 2)
This printable contains 12 basic equations to be solved. The first one is worked out as an example, and the answers for all can be found by clicking on a "Show Answers" box found on the website. The publisher has identified this as...


