Curated OER
Graphing Quadratic Functions
Pupils explore quadratic functions in this algebra activity. They investigate transformation of quadratic functions using the TI calculator. They use the vertex form for this activity.
Curated OER
Factoring Trinomials
Have the class factor and solve trinomials of integers in the form x2 + bx + c, where b and c are positive. They relate factoring to area and then follow a specific format to factor their trinomials. Tiles are used to help them...
Curated OER
Properties of Parabolas
Have your learners investigate parabolas. In this Algebra II lesson, students explore the basic definition of a parabola by using Cabri Jr. to create a parabola given the focus and directrix. Students interpret the equation for a...
Curated OER
Exploring Quadratic Equations
By stretching and translating the parabola given and determining the effects on the equation, students explore finding the vertex and zeros of a parabola and relate them to the equation. Students also view the intercept form to determine...
Curated OER
Properties of Parabolas
Learn to identify the properties of parabolas. High schoolers define parabola as the locus of all points equidistant from a fixed point and a fixed line. Also, interpret the equation for a parabola in vertex form and gain a visual...
Curated OER
Exponential Functions f(x) = abx
Students define exponential functions and graph the equation. In this algebra lesson, students discuss exponential growth and decay as they graph their functions. They differentiate between the base of growth and decay.
Curated OER
Functions and Inverses
Students solve problems identifying the functions and inverses. In this algebra activity, students identify a one-to-one function, and perform the horizontal line test. They analyze data and graph their results on a graph.
Curated OER
Explore Graphs and Factors
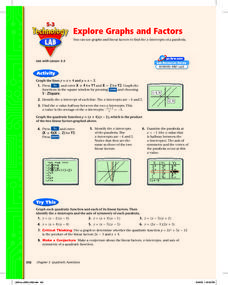
Pupils graph the factors of a quadratic as linear equations and graph the parabolic equation in factored form. Also, they investigate the relationship between the x-intercepts of the lines and the zeros of the parabola.
Curated OER
Evaluation Expressions
High schoolers explore algebraic expressions in this Algebra I lesson. They evaluate expressions using paper and pencil and then use the TI-83 to provide immediate reinforcements.
Curated OER
Characteristics of Exponential Functions
What can an upper grader do with an exponential function? They can solve and graph it, identify its important characteristic, and differentiate graphs based on shifts in graph bases that are greater or less than one. This 45 minute...
Curated OER
Factoring Trinomials
Learners factor trinomials and other quadratic functions. For this algebra lesson, students solve trinomials containing negative and positive coefficients. They factor quadratics of difference squares as well as regular polynomials.
Curated OER
Connecting Factors and Zeros
In this Algebra II lesson plan, students explore the connection between the factored form of a quadratics and the zero of a function. Students use a graphing calculator to verify factoring numerically and graphically.
Curated OER
Multiplication Equations
For this algebra worksheet, students solve one step equations using multiplication. They are reminded of an equation needing the same thing done to both sides. There are 12 linear problems.
Curated OER
Geometric Fractals and the Chaos Game
Students define fractals and patterns. They explore how a seemingly random process can result in a pattern. Students practice probability and fractions skills by playing the chaos game online.
Curated OER
Sum of Products and Product of Sums Expression
In this electrical circuit worksheet, students answer a series of 21 questions about sum of product and product of sum, and Boolean expression for a logic circuit. They design and build a circuit board using PC-board relays to show...
Curated OER
Introduction to Fractals: Infinity, Self-Similarity and Recursion.
This instructional activity introduces young scholars to the ideas involved in understanding fractals. They develop a sense of infinity, self-similarity and recursion and
Texas Instruments
Data Collection for Bar Graphs
Learners study the concept of central tendency in this data collection for bar graph lesson plan. They collect data outside as instructed and organize it into a bar graphs, then they list in specific groups the labels that appear on the...
Curated OER
Chart Your Course
Students explore change represented in graphs comparing distance and time. They exchange and share their graphs. Students interpret and create distance versus time line-graphs, and write stories based on these graphs. They interpret a...
Curated OER
Curve Ball
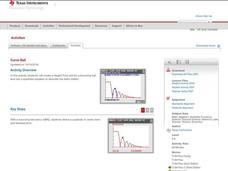
Learners explore the concept of parabolas by collecting quadratic data on a bouncing ball as it is falling using a motion detector. They plot the data and determine the equation of the quadratic in vertex form, then determine the values...
Curated OER
Woody Sine
High schoolers explore the concept of sine. In this sine lesson, students create a sine graph from tooth picks. High schoolers create a unit circle with tooth pick length radius. Students then take the tooth picks from the unit circle...
Curated OER
Parallel and Perpendicular Lines
Tenth graders explore parallel and perpendicular lines. In this geometry lesson, 10th graders investigate the relationships associated with parallel lines and transversals, perpendicular lines, and the angles formed by these...
Curated OER
Logarithmic Transformations
Using the TI calculator to visualize and make predictions, students perform transformation vertically and horizontally on logarithmic graphs in order to solve problems.
Curated OER
Estimating Deer Population
Students calculate the deer population using proportion. In this algebra lesson, students apply the concept of ratio and proportion to real life scenario.
Curated OER
Around The Stop Sign
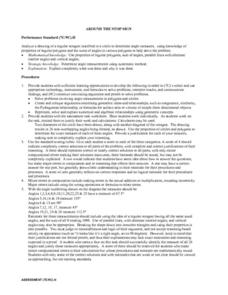
Students analyze a drawing of a regular octagon inscribed in a circle to determine angle measures, using knowledge of properties of regular polygons and the sums of angles in various polygons to help solve the problem. They use...


