California Education Partners
Miguel's Milkshakes
Moooove over, there's a better deal over there! The fourth segment in a series of eight requires individuals to determine the best unit cost for milk. Scholars calculate the least amount they can spend on a particular quantity of milk....
American Statistical Association
How Tall and How Many?
Is there a relationship between height and the number of siblings? Classmates collect data on their heights and numbers of brothers and sisters. They apply statistical methods to determine if such a relationship exists.
Cornell University
Beam Focusing Using Lenses
Explore optics using an inquiry-based experimental approach! Young scholars use a set of materials to design and build a unit capable of focusing a beam of light. They experiment with different lenses to determine the best approach to...
Noyce Foundation
Baseball Players
Baseball is all about statistics. Pupils solve problems related to mean, median, and range. They calculate the total weight of players given the mean weight, calculate the mean weight of reserve players given the mean weight of the...
Illustrative Mathematics
Sugar in Six Cans of Soda
Understanding how to multiply a whole number by a fraction is the key concept. Young mathematicians create a visual model of this real-world example and find the solution. Extensions are possible for making this an even richer activity....
Curated OER
Chocolate Graphing
Chocolate lovers develop a bar graph based on the types of chocolate the class likes. They participate in The Art of Chocolate at The Hershey Story before they make a bar graph that shows the favorite chocolate types of their class. They...
Curated OER
Graphing Inequalities in Two Variables
This study guide is a great resource to help you present the steps to graphing linear inequalities. Show your class two different ways to graph an inequality and work on a real-world example together. The document could also be easily...
Curated OER
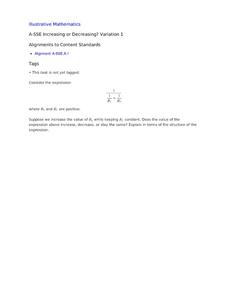
Increasing or Decreasing? Variation 1
Your algebra learners analyze the value of an algebraic expression to decide if it will increase, decrease, or stay the same when one variable is changed as the others stay constant. Their collaborative efforts culminate with a written...
Alabama Learning Exchange
Add, Subtract, and Multiply Matrices
Introduce the concept of matrices with a pre-designed instructional activity. Learners watch video lessons to learn the ins and outs of adding, subtracting, and multiplying matrices. Using provided problems, they practice each operation...
Armory Center for the Arts
Place Value Collage
How can art represent math? Use a lesson on place value collages to illustrate the different meanings that numbers have in their designated places. Kids observe photographs and paintings that show place value, then work on their own.
Center for Applied Linguistics
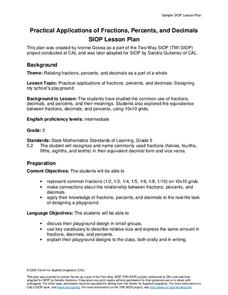
Practical Applications of Fractions, Percents, and Decimals
Young architects are prompted to design a playground in assigned groups. Using a 10 x 10 grid. Your fifth graders will apply their knowledge of fractions, percents, and decimals to the real-world task of designing a playground. Students...
Noyce Foundation
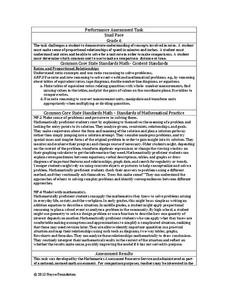
Snail Pace
Slow and steady wins the race? In the assessment task, scholars calculate the rates at which different snails travel in order to find the fastest snail. Hopefully, your class will move much more quickly in finishing the task!
Curated OER
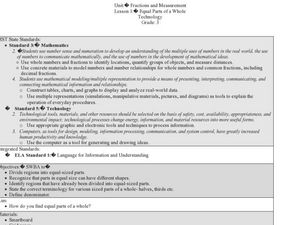
Fractions and Measurement
Using a Smart Board, or a plain ol' white board or chalkboard, the teacher pulls up a grid and demonstrates how squares and rectangles can be divided up into equal parts. The class will get their own graph paper to draw shapes and divide...
Illustrative Mathematics
Complex number patterns
Start off with the definition of the imaginary number i, then have your class practice simplifying expressions involving powers of i and look for patterns. See how the cyclic nature of powers of i translate to sums of powers of i.
Curated OER
Students' Strides
Complete problems using base ten blocks to see the difference in the place value of a decimal and how it affects a number's value. Learners compare decimal values as well. Ample time for discussion and modeling are allowed in the...
Curated OER
Decimal War
Pupils play a math game. In this decimals and fractions lesson, they use base ten blocks to practice converting between decimals and fractions. Everyone plays a game called Decimal War to practice these concepts.
Curated OER
Make a Math Mascot
Create a math mascot by identifying irrational and rational numbers. Learners will also solve linear equations.
Curated OER
Devising a Measure for Correlation
How well does your class understand the concept of correlation? Use an activity to explore different methods of calculating correlation. Working alone and then in groups, your class will make decisions on what math to apply to the...
Curated OER
Mapping Where Animals Live
What type of reptiles live in New York State? This lesson plan gets the class thinking about what factors determine where particular animals live. They analyze the Hudson Valley environment, identify specific reptile and amphibian...
Curated OER
Solving Quadratic Trigonometric Equations
In this trigonometry instructional activity, students solve quadratic trigonometric equations. The seven page instructional activity contains explanation, examples, and sixteen multi-part questions. Answers are not included.
Curated OER
Mr. Cobbler's Shoe Dilemma
Students employ statistics to solve real-world problems. They collect, organize and describe data. They make inferences based on data analysis. They construct, read, and interpret tables, charts and graphs.
Curated OER
Examining Geometric Solids
Students explore geometry by completing a math worksheet in class. In this shape identification lesson, students identify the characteristics associated with 15 solid geometric shapes. Students identify patterns between vertices, edges...
Curated OER
Why Guess When You Can Estimate
They apply various strategies in their estimations. They analyze the differences between guessing and estimating. They estimate the number of beans and jellybeans in egg cartons and jars respectively.
Curated OER
Pigs, Pigs, Pigs!
Third graders find information about different breeds of pigs using the Internet, books, and encyclopedias. Groups select one breed of pig that interests them. They construct a stuffed likeness of the pig.


