Curated OER
Asthma "Outbreak" Exercise
Students investigate numerical data on a possible asthma epidemic. Using statistical information, students graph and figure ratios of the epidemic. They evaluate the mortality rate from severe smog in the 1950's in London.
Curated OER
Treats in a Basket
Students explore probability by participating in an experimental activity. In this number statistics activity, students collaborate in groups in which they move a game piece around a board. Students calculate their probability of landing...
Curated OER
Table Readings
In this table worksheet, students read questions and interpret tables. Questions include information concerning unemployment, oil imports, and foreign students. This multiple-choice worksheet contains 10 problems. Answers are provided.
Curated OER
What Are The Chances
Students calculate the probability of an event occurring. In this probability lesson, students differentiate between independent, dependent or compound events. They find the range of the data.
Curated OER
Discovering Advanced Algebra More Practice Your Skills, Lessons 11.1-11.6
In this six page series of worksheet, students answer short answer questions about a variety of topics. The six topics covered in this packet are: Experimental Design (4 questions), Probability Distributions (3 multiple choice...
Curated OER
Two-factor ANOVA
For this statistics and probability worksheet, students analyze the variance (ANOVA) to determine if two or more samples have the same "mean" or average. The one page worksheet contains three problems. Answers are provided.
Curated OER
Pwerball Problem
In this statistics and probability worksheet, students consider the problem of lowering the odds of the Powerball lottery by determining the range of the white balls and the powerball. The one page worksheet contains one problem with...
Curated OER
Candy Problem
In this stats worksheet, students identify how many ways there are to split 25 pieces of candy in between 3 people. There is a very detailed answer key with this problem.
Curated OER
Math Lesson: What Do You Want to Know? - Country Statistics
Students are able to identify the characteristics of a variety of graphs (i.e. bar graph, line graph, pie graph, scatter plot, population pyramids, etc.) They recognize how the type of data to be presented plays a role in choosing the...
Curated OER
Sampling Distribution and Estimators Section 6.4
In this distribution worksheet, students examine given situations, determine the probability of an event, identify the standard deviation, and find a specified percentile and quartiles. Five probability story problems are available on...
Curated OER
Introduction to Descriptive Statistics
Students follow examples to study basic concepts of statistics. They work independently through the activities.
Curated OER
Rolling For Value
Young scholars participate in a lesson to comprehend the concept of probability while rolling dice. They recognize patterns while making observations and recording the data for each roll. Students also review place values while playing a...
Curated OER
Statistical Specimens
Third graders are introduced to statistical vocabulary. They complete an online activity that asks them to calculate the mean, median and mode for a set of data.
Curated OER
The Probability that God Exists
In this probability worksheet, students are presented with how a scientist calculated the chance that God exists. References to scientists, mathematicians, and books are made.
Curated OER
Tree Diagrams
In this tree diagram worksheet, students read story problems. From the given information, they draw tree diagrams to determine the total possible number of outcomes. This one-page worksheet contains ten problems.
Curated OER
Form an Opinion-Cats
Students discuss which animal makes a better pet. In this statistics lesson, students examine the factors that cause people to choose one animal over the other (cat or dog). Students discuss their own opinions, and then view a video...
Inside Mathematics
Suzi's Company
The mean might not always be the best representation of the average. The assessment task has individuals determine the measures of center for the salaries of a company. They determine which of the three would be the best representation...
Virginia Department of Education
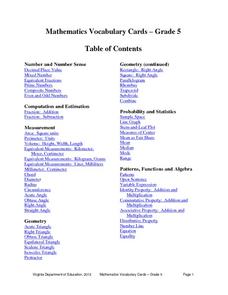
Mathematics Vocabulary Cards - Grade 5
Elevate your fifth graders' understanding of math concepts with a series of vocabulary posters. Featuring terms concerning probability and statistics, measurement, algebra, and decimal place value (and many more), the posters are sure to...
Biology Junction
Genetic Problems
In a world of DNA testing popularity, understanding how to solve basic genetic problems allows scholars to better understand and interpret test results. They work through many different types of genetic problems using statistics, Punnett...
Illustrative Mathematics
Do You Fit In This Car?
A short activity that focuses on the normal distribution as a model for data distribution. Using given means and standard deviations, your budding statisticians can use statistical tables, calculators, or other statistical software to...
Curated OER
Disease and Epidemics
Explore how the study of diseases and epidemics can be comprehended from a mathematical perspective. Investigate finite geometric series, calculating threshold values, and statistical models of the spread of disease. How many makes it an...
Education World
High, Low, or In Between?
Trios play a card game that reinforces the concepts of number sequence and greater than and less than. Scholars make predictions based on information they know and a single unknown. They see cards drawn by others in the group, but not...
Curated OER
China's Population Growth
Learners collect data from China's population growth and determine the mean, median, and mode from the data. In this data lesson plan, pupils determine probabilities and use them to make predictions.
Curated OER
Old Glory
Learners utilize mathematical concepts such as: measurement, ratio and proportion and geometric probability to analyze the components of the U.S. Flag. They collect, organize and interpret data by constructing charts, tables and graphs...
Other popular searches
- Probability and Statistics
- Probability Statistics
- Probability" | "Statistics
- Probability & Statistics


