University of Arizona
Skittles & M&Ms Probability Experiment
Students are introduced to the scientific method by hypothesizing, counting, analyzing and concluding which company packs candy more reliably - Skittles or M&Ms.
Curated OER
Quarter, Nickel, Dime....
An engaging game called, "Quarter, Nickel, and Dime" is presented in this math lesson. Players are given an envelope with slips of paper that represent the three coins. In pairs, they play the game 18 times, and the whole class charts...
Curated OER
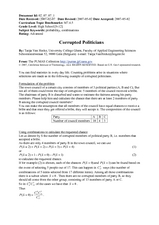
Corrupted Politicians
High schoolers solve problems using statistics and probability. In this math lesson, students analyze how many corrupted members there are in a fictional town council. They give real life examples where statistics and probability can be...
Curated OER
Quick Stats with Quick Poll
Learners analyze data using bar graphs and the TI in this statistics lesson plan. They investigate quick polls and graph the data using different properties of statistics. This assignment requires a TI Navigator.
Curated OER
Make a Pass at Me
Students identify different types of functions and units of measurements. In this statistics lesson plan, students will collect data, graph their data and make predictions about their data. They plot a linear regression graph.
Curated OER
Data Analysis Using Technology
Analyze data using technology. Middle schoolers design data investigations, describe data, and draw their own conclusions. Then they select the best type of graph, graph and interpret the data, and look for patterns in trends. They also...
Curated OER
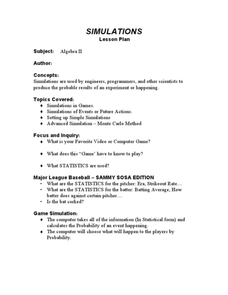
Simulation and Statistics
Students perform simulation of video games as they explore statistics. In this algebra lesson plan, students relate concepts of statistics and data collection to solve problems. They decide their next step based on the previous...
Curated OER
Past and Present: Using baseball statistics to teach math
Pupils use baseball cards to add up batting average and reinforce math skills. In this batting averages lesson plan, students use old baseball cards to practice different math skills and look at other baseball statistics.
Curated OER
What is Probability?
Students participate in a variety of activities in order to understand the concept of probability. The students are engaged because of the application of The Multiple Intelligences Theory.
Curated OER
An Introduction to Mathematica and the "Birthday Problem"
Twelfth graders determine the probability of two people in their class sharing the same birthday. In this determining the probability of two people in their class sharing the same birthday problem instructional activity, 12th graders...
Curated OER
Penny's Pizza
Students develop a list of possible outcomes as a method of finding probability related to a pizza statistics problems. They read the problems together as a class, brainstorm ways to solve the problem, and in partners solve the pizza...
Curated OER
Heads or Tails
Seventh graders compare experimental and theoretical probabilities. In this comparing experimental and theoretical probabilities lesson, 7th graders discuss the theoretical probability of flipping a coin. Students flip a coin 25 times...
Curated OER
The Mathematical Implications of Lying
Students explore how statistics can be interpreted in different ways. In this probability lesson plan students complete a class lab activity then discuss their findings.
Curated OER
The Monty Hall Problem
Students define and differentiate between experimental and theoretical probability. In this statistic lesson, students play the game "Monty Hall" and use probability to come up with the best strategies to play the game.
Curated OER
Lucky 7s
This helpful lesson explores the probability in tossing a coin and throwing dice. Specifically, it looks at the probability of getting numbers that are significant to the game of craps, assuming that once the math is understood, most...
Curated OER
Is This Really Okay for Me? A Public Health Statistical Analysis
Future public health consultants are asked in a letter to help determine if a fictitious drug is causing birth defects in a population. They perform a simulation using beans and probability calculations to come to a conclusion. Note that...
Curated OER
Data Collection
High schoolers investigate qualitative and quantitative data. For this statistics lesson, students gather data on heights and weights of people and graph the distribution. High schoolers discuss the differences between qualitative and...
Statistics Education Web
When 95% Accurate Isn’t
Investigate the effect of false positives on probability calculation with an activity that asks scholars to collect simulated data generated by a calculator. To finish, participants analyze the probability of certain outcomes which lead...
Statistics Education Web
The Egg Roulette Game
Hard boiled or raw? Which egg will you get? A hands-on activity has scholars explore the impact of conditional probability. Based on a skit from the Tonight Show, pupils model the selection of the two types of eggs using beads. They...
Virginia Department of Education
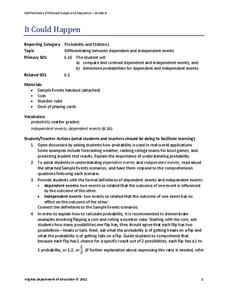
It Could Happen
Understanding of probability will probably increase with the use of a refined resource. Pupils learn to distinguish between dependent and independent events as they calculate the probabilities of these types of events in various situations.
EngageNY
Events and Venn Diagrams
Time for statistics and learning to overlap! Learners examine Venn Diagrams as a means to organize data. They then use the diagrams to calculate simple and compound probabilities.
EngageNY
Ruling Out Chance (part 2)
Help your classes find the significance in this lesson! Learners analyze the probability of Diff values. They then determine if the difference is significant based on their probability of occurrence.
American Statistical Association
How Tall and How Many?
Is there a relationship between height and the number of siblings? Classmates collect data on their heights and numbers of brothers and sisters. They apply statistical methods to determine if such a relationship exists.
Bowland
Speed Cameras
Do speed cameras help reduce accidents? Scholars investigate this question using a series of spreadsheet activities. Along the way, they learn about randomness, probability, and statistical analysis.
Other popular searches
- Probability and Statistics
- Probability Statistics
- Probability" | "Statistics
- Probability & Statistics


