American Statistical Association
Armspans
Young mathematicians collect data on the arm spans of classmates. Then they sort the data by measures of center, spread, and standard deviation. Finally, they compare groups, such as boys and girls, to interpret any differences.
Radford University
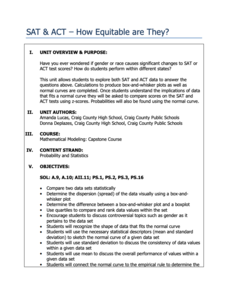
SAT and ACT – How Equitable Are They?
Test the test takers' knowledge of statistics about data from the SAT and ACT tests. Future collegians explore the idea of gender and racial bias in high-stakes college admissions exams. They analyze historical data on average scores by...
Curated OER
Sampling Bias And the California Recall
Using a 2002 California Gray David recall vote as an example, young statisticians identify sources of bias in samples and find ways of reducing and eliminating sampling bias. They consider ways to select random samples from a...
Curated OER
The Vietnam Lotteries
In this probability and statistics worksheet, students examine the “fairness” to the Vietnam draft lottery system by constructing box plots of each of the twelve months using data provided. The three page worksheet contains one problem...
Curated OER
Measures of Central Tendencies: Quartiles
In this statistics worksheet, students calculate the mean, median, mode, range, lower quartile, and upper quartile for 10 questions and interpret a box and whiskers graph.
Curated OER
How's The Weather?
Students make a box and whiskers plot using the TI-73 graphing calculator. Each student would have their own calculator but they would work in small groups of two or three to help each other enter the data and make the plots.
Curated OER
Describing Data
Your learners will practice many ways of describing data using coordinate algebra in this unit written to address many Common Core State Standards. Simple examples of different ways to organize data are shared and then practice problems...
Statistics Education Web
Now You SeeIt, Now You Don't: Using SeeIt to Compare Stacked Dotplots to Boxplots
How does your data stack up? A hands-on activity asks pupils to collect a set of data by measuring their right-hand reach. Your classes then analyze their data using a free online software program and make conclusions as to the...
Inside Mathematics
Suzi's Company
The mean might not always be the best representation of the average. The assessment task has individuals determine the measures of center for the salaries of a company. They determine which of the three would be the best representation...
American Statistical Association
Step into Statastics
Class members study the size of classmates' feet and perform a statistical analysis of their data. They solve for central tendencies, quartiles, and spread for the entire group as well as subgroups. They then write a conclusion based on...
Curated OER
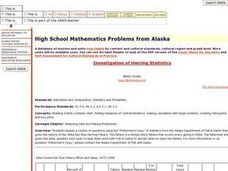
High School Mathematics Problems from Alaska: Investigation of Herring Statistics
Students read complex charts, find measures of central tendency, calculate large numbers, create histograms and box plots. They answer questions using the "Fisherman's Copy" of statistics.
Curated OER
Minimum, Maximum and Quartiles
In this statistics worksheet, students identify the different parts of a whisker plot. They find the minimum, maximum and the three different quartiles. There are 8 multiple choice questions with an answer key.
Curated OER
Stem-and- Leaf Plots
Students are introduce to the notion of stem-and-leaf plots. They use stem-and-leaf plots to calculate the mean, median, and mode of a set of data. Students use computers to learn about stem-and-leaf plots.
Curated OER
Analyzing Graphs and Data
Students collect and analyze data. In this statistics instructional activity, students graph their data and make inferences from the collected data. They display their data using graphs, bar graphs, circles graphs and Venn diagrams.
Curated OER
The Dog Days of Data
Students are introduced to the organization of data This lesson is designed using stem and leaf plots. After gather data, they create a visual representation of their data through the use of a stem and leaf plot. Students
drawing...
Curated OER
Stem-and-Leaf Plots
Students are introduced to stem-and-leaf plots and calculating the mean, median, and mode from the plots.
Curated OER
Box-and-Whisker
Seventh graders are introduced to the concept of box-and-whisker plots. A step-by-step process for creating a box-and-whisker plot is provided. The goal of the instructional activity is that students study the components of a...
Curated OER
Census Statistics and Graphing
Pupils graphically represent data from the Census. In this middle school mathematics lesson, students investigate the housing characteristics of different tribes of Native Americans and compare them to the average American population. ...
Curated OER
Fruit Loops/Cheerios Activity: Measures of Central Tendency
In this measures of central tendency learning exercise, students use Fruit Loops and Cheerios to gather statistical data. They find the mean, mode and median of the data. Students construct a box-and-whisker plot of the class data. ...
Curated OER
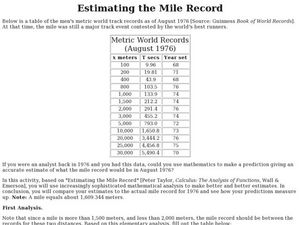
Estimating the Mile Record
In this estimating the mile record, students examine given data. They use create a box-and-whisker plot to determine the upper and lower quartiles of the data. This one-page instructional activity contains 1 multi-step problems.
Curated OER
Remembering Our Veterans
Eighth graders research a variety of military statistics while using the theme of Remebering Our Veterans. They use data management to plan and create a PowerPoint presentation with their findings. They incorporate different types of...
Shodor Education Foundation
Algorithm Discovery with Venn Diagrams
Here is a lesson that takes an interesting approach to analyzing data using box and whisker plots. By using an applet that dynamically generates Venn diagrams, the class forms a strategy/algorithm for guessing the rule that fits the...
Statistics Education Web
Sampling in Archaeology
Compare different random sampling types using an archaeological setting. Scholars collect data from an archaeological plot using simple random samples, stratified random samples, systematic random samples, and cluster random samples....
American Statistical Association
An A-MAZE-ING Comparison
Teach your class how to use descriptive statistics through a hands-on data collection activity. Pupils collect their own data, calculate test statistics, and interpret the results in context. They compare male and female results, looking...


