Primary Resources
Primary Resources: Mean, Median, Mode, and Range
Here are some teacher resources to aid in teaching mean, median, mode and range. Includes worksheets, games, and PowerPoint presentations.
Ministry of Education, Sports & Culture (Samoa) Government
Mesc: Samoa School Net: Mean, Median, Mode
A 2-part learning module on mean, median, and mode. Explains their definitions and discusses how to choose which term to best describe your data. Includes many well-illustrated examples. (There are a few typos, and money amounts are in...
Math Drills
Math Drills: Statistics and Probability Worksheets
Download these free worksheets to sharpen your skills with statistics and probability. Sheets focus on collecting and organizing data, measures of central tendency (mean, median, mode, and range), and probability.
Calculator Soup
Calculator Soup: Mean, Median, Mode Calculator
Calculate mean, median, mode along with the minimum, maximum, range, count, and sum for a set of data.
CK-12 Foundation
Ck 12: Physical Science: Descriptive Statistics
[Free Registration/Login may be required to access all resource tools.] Explains descriptive statistics (mean, median, mode, range).
Missouri State University
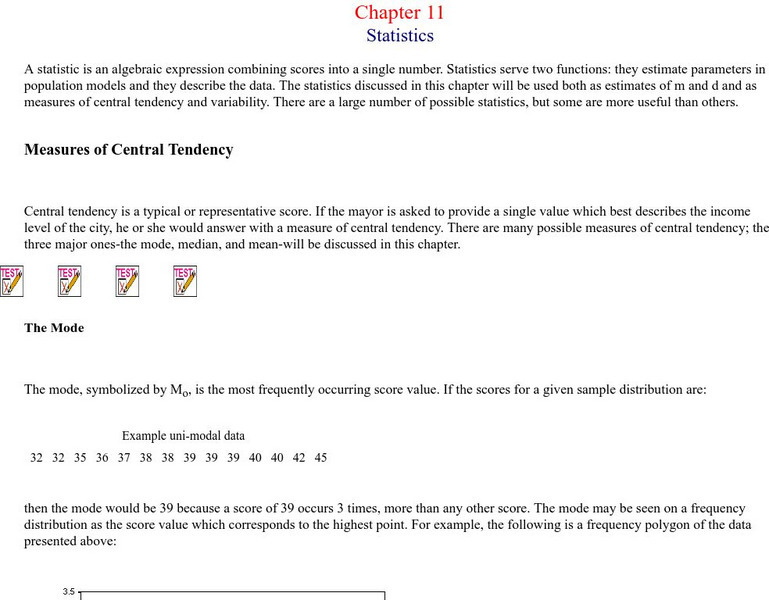
Missouri State University: Introductory Statistics: Statistics
This is an excellent resource on what the science of statistics involves. There are all kinds of definitions, examples, graphs, and charts to learn from. The topics covered include: mode, mean, median, skewed distributions and measures...
Texas Instruments
Texas Instruments: Data and Statistical Methods 1
In this set of exercises, a set of data is provided; students answer questions about mean, median, mode, and quartiles. Questions are multiple choice with solutions provided.
Varsity Tutors
Varsity Tutors: Hotmath: Practice Problems: Statistics
Fifteen problems presented on the topics: mean, median, mode, outliers and graphing statistics. They are given with each step to the solution cleverly revealed one at a time. You can work each step of the problem then click the "View...
Rice University
Hyper Stat Online Statistics Textbook: Central Tendency
Click on mean, median, mode, trimean, or trimmed mean to review central tendency.
CK-12 Foundation
Ck 12: Statistics: Stem and Leaf Plots, Mean, Median, and Mode
[Free Registration/Login may be required to access all resource tools.] Find the mean, median, and mode of a set of data displayed in a stem-and-leaf plot.
University of North Carolina
University of North Carolina Writing Center Handouts: Statistics
When presenting an argument, the use of statistics to support a point can be very effective. This handout offers advice on both how to read statistics so that you understand exactly what they mean, and how to use them in your argument so...
Other
Magoosh: Statistics Fundamentals
An online course on the fundamentals of statistics including video lessons in Mean, Median, and Mode; Weighted Averages; Quartiles and Boxplots; Range and Standard Deviation; Normal Distribution; Z-scores; Intro to Inferential...
Shodor Education Foundation
Shodor Interactivate: Lesson: Introduction to Statistics
"The goal of this lesson is to introduce the concepts of mean, median and mode and to develop understanding and familiarity with these ideas." This lesson is provided by Shodor Education Foundation.
Missouri State University
Missouri State University: Introductory Statistics: The Normal Curve
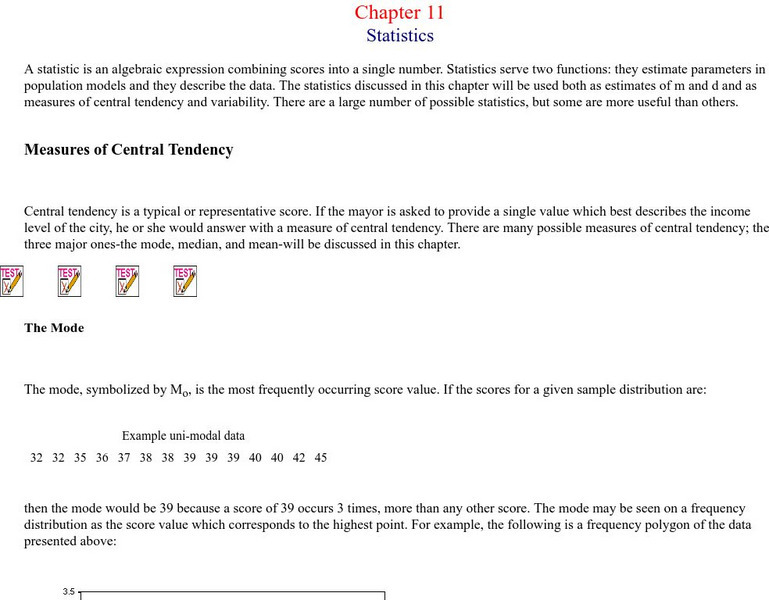
Provides lengthy explanations of the measures of central tendencies - mean, mode, and median - and the measures of variability - range, variance, standard deviation - are given here. Graphs of interesting "side items" are presented as...
Missouri State University
Missouri State U.: Statistics: Measures of Central Tendency and Variability
Provides lengthy explanations of the measures of central tendency - mean, mode, and median - and the measures of variability - range, variance, standard deviation. Graphs of interesting examples are presented as well, skewed...
Education Development Center
Math Partners: Statistics and Probability [Pdf]
Comprehensive unit that consists of lessons and activities designed to help students learn statistics and probability concepts.
BBC
Bbc Revise Wise Maths: Mode, Median, Mean
This website from the BBC is a great introduction to averages (mean, median, and mode) and will take you through some interactive learning activities. A practice test and worksheet are also provided.
Calculator Soup
Calculator Soup: Statistics Calculator
Calculate basic summary statistics for a sample or population data set including minimum, maximum, range, sum, count, mean, median, mode, standard deviation and variance.
McGraw Hill
Glencoe: Self Check Quizzes 1 Mean
Use Glencoe's randomly generated self-checking quiz to test your knowledge of finding the mean for a data set. Each question has a "Hint" link to help. Choose the correct answer for each problem. At the bottom of the page click the...
Other
Stat Soft: Statistics Glossary
Dozens of statistical terms are defined and illustrated in this glossary.
TeachEngineering
Teach Engineering: Means, Modes, and Medians
Students experience data collection, analysis and inquiry in this LEGO MINDSTORMS NXT -based activity. They measure the position of an oscillating platform using a ultrasonic sensor and perform statistical analysis to determine the mean,...
Oswego City School District
Regents Exam Prep Center: Statistical Studies, Central Tendency, and Dispersion
The mathematics tutorial investigates statistical studies, central tendency, and dispersion. The lesson consists of class notes, calculator tips, examples, and practice problems with solutions. The teacher resource includes an activity...
Soft Schools
Soft Schools: Probability and Statistics Quiz
Students are asked to find the mean, median, mode, and range of a data set. Also, they must be able to interpret graphs and tables, and graphically represent data. The quiz is multiple choice and consists of nine questions, and a summary...
Texas Instruments
Texas Instruments: Statistics for Math B
Students will determine the mean, median, mode and standard deviation of collected data. They will make a frequency histogram of the grouped data, both on graph paper, and on the TI 83+.


