Scholastic
Scholastic: Cultivating Data
Students will understand key concepts of data analysis and their graphic representations. Students will construct and interpret data tables, line plots, box-and-whisker plots and stem-and-leaf plots, scatterplots with line of best fit,...
Texas Instruments
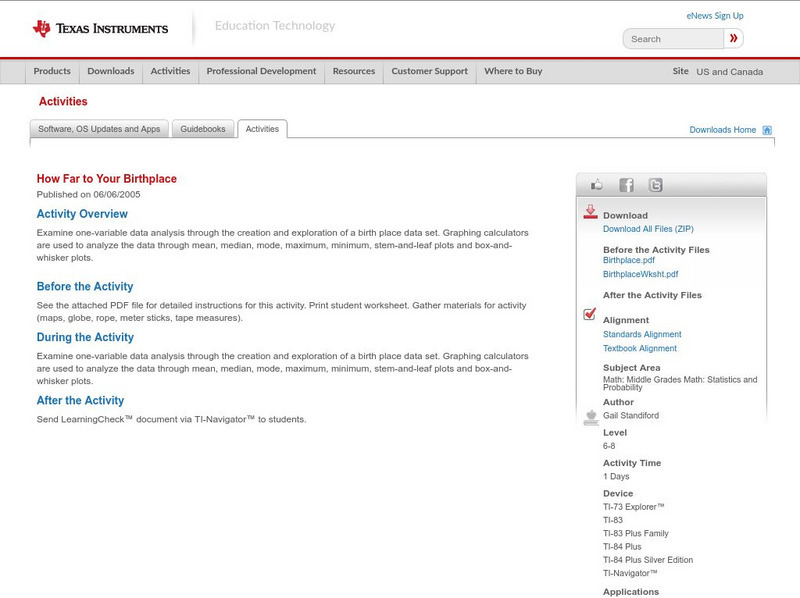
Texas Instruments: How Far to Your Birthplace
Examine one-variable data analysis through the creation and exploration of a birth place data set. Graphing calculators are used to analyze the data through mean, median, mode, maximum, minimum, stem-and-leaf plots and box-and-whisker...
CK-12 Foundation
Ck 12: Statistics: Displaying Univariate Data
[Free Registration/Login may be required to access all resource tools.] This Concept shows student how to make stem-and-leaf plots as well as dot plots in order to display data with one variable.
Oswego City School District
Regents Exam Prep Center: Practice With Organizing and Interpreting Data
Several problems are presented to test your skills in creating and interpreting frequency tables, pie charts, box-and-whisker and stem-and-leaf plots.
Alabama Learning Exchange
Alex: Heads Up!
The lesson plan is a hands-on project. Middle schoolers will work in pairs to gather various measurements, organizing the data into a provided chart. The measurements will be used to review, reinforce, and introduce skills such as...
National Council of Teachers of Mathematics
Nctm: Illuminations: State Names
Students use multiple representations to display how many times the letters of the alphabet is used in a state name. Concepts explored: stem and leaf, box and whisker plots, histograms.
Huntington Library
Huntington Library: Garden Lesson Plans: Learning From Leaves: Adaptation [Pdf]
A scavenger hunt where students find and study examples of leaf adaptations for different environments. This activity is designed to be used on a visit to botanical gardens or greenhouse but could be adapted and used with specimens in...
Huntington Library
Huntington Library: Garden Lesson Plans: Learning From Leaves [Pdf]
An investigation into how light levels affect leaf adaptations in plants.
University of Illinois
University of Illinois: Statistics a La Mode
Site from the University of Illinois gives examples using stem and leaf plots to find the mode. It also provides practice examples for students to try. It gives the correct answers and provides a definition of the word mode and where it...
National Council of Teachers of Mathematics
Nctm: Illuminations: Advanced Data Grapher
The Advanced Data Grapher can be used to analyze data with box plots, bubble graphs, scatterplots, histograms, and stem-and-leaf plots.
Concord Consortium
Concord Consortium: Stem Resources: Photosynthesis
This activity introduces the concept of plant color being determined by pigments, which interactive with light. The idea that chlorophyll is used by plants for energy is then discussed, along with the first step of the photosynthetic...
Science Buddies
Science Buddies: Measure Photosynthesis With Floating Leaves
In this activity, you will be able to observe the oxygen production in leaves by doing a floating leaf disk experiment. You can also find out how quickly plants produce oxygen, and what variables affect photosynthesis.
Other
Atlas of Plant Anatomy
This impressive site provides a wealth of information on roots, stems, and leaves. To retrieve information, you simply pass the mouse over the photos and click the highlighted area to receive an explanation about the structure.
Texas Education Agency
Texas Gateway: Selecting and Using Representations for Collected Data
[Accessible by TX Educators. Free Registration/Login Required] Given a variety of data (including line plots, line graphs, stem and leaf plots, circle graphs, bar graphs, box and whisker plots, histograms, and Venn diagrams), the student...
TeachEngineering
Teach Engineering: Exploring the Lotus Effect
Students test and observe the "self-cleaning" lotus effect using a lotus leaf and cloth treated with a synthetic lotus-like superhydrophobic coating. They also observe the Wenzel and Cassie Baxter wetting states by creating and...
TeachEngineering
Teach Engineering: Surface Tension
Surface tension accounts for many of the interesting properties we associate with water. By learning about surface tension and adhesive forces, students learn why liquid jets of water break into droplets rather than staying in a...
TeachEngineering
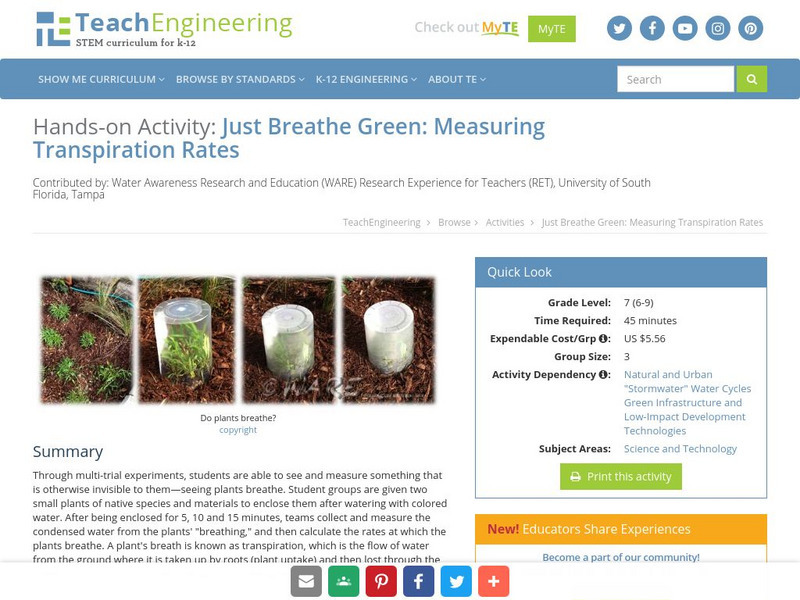
Teach Engineering: Just Breathe Green: Measuring Transpiration Rates
Through multi-trial experiments, students are able to see and measure something that is otherwise invisible to them- seeing plants transpire. This information will allow students to consider how a plant's unique characteristics (leaf...
Other
Online Statistics Education: Graphing Distributions [Pdf]
This is the second chapter of a statistics e-text developed collaboratively by Rice University, University of Houston Clear Lake, and Tufts University. It looks at many different types of data displays and the advantages and...
University of Georgia
University of Georgia: Definitions in Statistics
This site contains definitions to use in statistics and ways to collect data.
University of Georgia
University of Georgia: Measures of Variation
Lesson plan introduces and explains how to calculate measures of variation concepts such as range and quartile.
Middle School Science
Middle School Science: "Sinkin' Lincoln" Lab (Lesson Plan)
In this lesson plan site, students will "Define surface tension, determine what factors affect surface tension, and collect data on how many drops of water a penny can hold."
TeachEngineering
Teach Engineering: Acid Rain Effects
Students conduct a simple experiment to model and explore the harmful effects of acid rain (vinegar) on living (green leaf and eggshell) and non-living (paper clip) objects.
CK-12 Foundation
Ck 12: Types of Data Representation: Graphic Displays of Data
[Free Registration/Login may be required to access all resource tools.] Here you will explore displays of data using bar charts, histograms, pie charts and boxplots, and learn about the differences and similarities between them and how...
Middle School Science
Middle School science.com: Smile Metric Style Lesson
In this lesson plan site, students will learn how to use a metric ruler to measure length, accurately read and record measurements taken in centimeters and millimeters, and collect and analyze data using a stem and leaf.
Other popular searches
- Stem and Leaf Plots
- Stem and Leaf Plots
- Stem & Leaf Graph
- Stem Leaf Plots
- Math Stem and Leaf Plots
- Stem and Leaf Graphs
- Creating Stem and Leaf Plot
- Stem and Leaf Plot Images
- Back Stem and Leaf
- Stem and Leaf Diagrams
- Stem Leaf Graph


