Curated OER
Three Leaf Clover Exploration
In this three leaf clover worksheet, students follow the directions for a word problem about columns and rows using three leaf clovers. Students complete 1 problem.
Curated OER
Asexual Propagation
Jeopardy is always a fun way to review multiple areas of information from a topic. There are 5 categories included in this game focused on propagating plants. Subjects such as cuttings and leaf-buds are well detailed.
Curated OER
Statistics
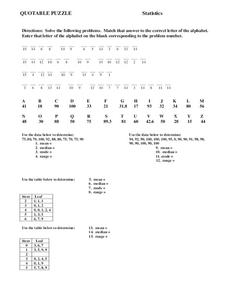
In this statistics worksheet, 8th graders solve and complete 15 different problems. First, they solve each problem by using the data given to determine the mean, median, mode, and range for each set. Then, students match that answer to...
Curated OER
Flicking Football Fun
Young mathematicians fold and flick their way to a deeper understanding of statistics with a fun, hands-on math unit. Over the course of four lessons, students use paper footballs to generate data as they learn how to create line...
Houghton Mifflin Harcourt
Unit 3 Math Vocabulary Cards (Grade 5)
Fifty-four flashcards make up a set to help reinforce math vocabulary. The set offers two types of cards; a word card printed in bold font, and a definition card equipped with an example and labels. Terms include capacity, histogram,...
Curated OER
Drops on a Penny
Eighth graders experiment to determine the number of drops of water a heads up penny hold. They create a stem and leaf graph of the class results and use the data for further experimentation on a tails up penny.
Curated OER
Plot It
Students use a stem-and-leaf plot from a set of data to identify the range, median, and mode of their own math grades.
Curated OER
Organizing Data
In this statistics activity, 11th graders collect data and organize it using a frequency table. They plot their data and analyze it using stem and leaf plots. There are 3 questions with an answer key.
Curated OER
Integration: Statistics
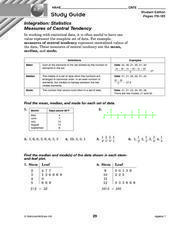
For this math worksheet, students find the mean, median and mode for 6 number sets. Students then find the median and mode for data found in 2 stem-and-leaf plots.
Curated OER
Statistics with State Names
Students analyze the number of times each letter in the alphabet is used in the names of the states. In this statistics lesson, students create a stem and leaf plot, box and whisker plot and a histogram to analyze their data.
Curated OER
Super Bowl Champs
In this Super Bowl instructional activity, students create line plots of all winners and losers of the Super Bowl. They create stem-and-leaf plots, scatter plots, and bar graphs of football data. This one-page instructional activity...
Curated OER
Parts of the Plant and Their Functions
Delving into this slideshow will help the students understand the composition of plants and their structures. Each slide identifies certain structures and explores how they support the plant's survival along with assisting our...
Curated OER
Leaf Straw
Students investigate plant structure and the process of photosynthesis. Using everyday items, they demonstrate that the leaves and stems of plants can act like a straw. In addition, they identify plant structure.
Curated OER
Plants
Learners illustrate the major parts of a plant, classify some plant foods we eat as roots, stems, leaves, flowers, fruits and seeds. They also name some animals that use seeds, leaves, and fruit for food.
Curated OER
Interpreting and Displaying Sets of Data
Students explore the concept of interpreting data. In this interpreting data lesson, students make a line plot of themselves according to the number of cubes they can hold in their hand. Students create their own data to graph and...
Curated OER
Leaf People
Students use fall leaves for art projects. In this art activity, students use leaves to create leaf people. Students take a nature walk in fall and collect leaves. Students make arms and legs and paste them to the leaf.
Curated OER
Leaf Identification
Learners identify different leaf types. They examine their patterns, shapes and colors. They complete a worksheet to end the lesson.
Curated OER
Univariate Data Analysis
Students use given data to compare baseball players. They create box and whisker plots to compare the players and determine which they feel is the best player. Students use calculators to make box and whisker plots. They write paragraphs...
New South Wales Department of Education
History of Plant Classification
Bamboo, the fastest growing plant in the world, can grow up to 35 inches in one day! Pupils learn how plants historically have been classified and determine if these traits are appropriate to use in this 17th lesson of 20. They will also...
Fort Bend Independent School District
Data Analysis - AP Statistics
What better way to study survey design than to design your own survey! Bring a versatile data analysis project to your AP Statistics class, and encourage them to apply the practices from their instructions to a real-world survey project.
Virginia Department of Education
Graphs
Examine different types of graphs as a means for analyzing data. Math scholars identify the type of graph from a series of data displays and then develop questions to match each one. Then, given a scatter plot of height versus age data,...
CK-12 Foundation
Graphs for Discrete and for Continuous Data: Discrete vs. Continuous Data
Not all data is the same. Using the interactive, pupils compare data represented in two different ways. The learners develop an understanding of the difference between discrete and continuous data and the different ways to represent each...
College Board
2007 AP® Statistics Free-Response Questions Form B
So that is how they do it! Pupils and teachers see how College Board assesses topics using the free-response questions from Form B of the 2007 AP® Statistics test. The six questions are divided in two sections, the first five being more...
Rice University
Introductory Statistics
Statistically speaking, the content covers several grades. Featuring all of the statistics typically covered in a college-level Statistics course, the expansive content spans from sixth grade on up to high school. Material comes from a...
Other popular searches
- Stem and Leaf Plots
- Stem and Leaf Plots
- Stem & Leaf Graph
- Stem Leaf Plots
- Math Stem and Leaf Plots
- Stem and Leaf Graphs
- Creating Stem and Leaf Plot
- Stem and Leaf Plot Images
- Back Stem and Leaf
- Stem and Leaf Diagrams
- Stem Leaf Graph


