Curated OER
Travel Mug Design
Students create and develop a travel mug. They create visuals and a three dimensional infomercial. They apply an engineering design and demonstrate knowledge of thermodynamics involved in heat transfer. They illustrate Newton's Law of...
Curated OER
Statistics: Misleading or Accurate?
Students explore the concept of misleading statistics. In this misleading statistics lesson, students play a game of tag and graph the number of times each student gets tagged. Students use the graph to determine the fastest runner in...
Curated OER
Statistics Newscast in Math Class
Students study sports teams, gather data about the teams, and create a newscast about their data. For this sports analysis lesson, students research two teams and define their statistical data. Students compare the two teams, make...
Curated OER
Show Me!
Young scholars analyze and interpret graphs. In this graphing lesson, students view a video and construct their own graphs (line, circle, bar) from given sets of data.
Curated OER
ou are the Researcher!
Students conduct a census at school. They collect data, tally it, and create a frequency table. Students display their data in three different types of graphs. They write complete sentences describing the graph.
Curated OER
Family Activity: Bar Graphs and Line Graphs
In this math worksheet, students work at home with a family member on a graphing activity. Students count the number of cans, glass jars, boxes and bags in the pantry. Students make a bar and a line graph to represent the data.
Curated OER
Ready for Roots
Fourth graders sort seeds and predict what conditions are needed for them to germinate. They keep the seeds moist, observe and measure their growth and graph the results. As the seeds start to grow students compare and contrast the each...
Curated OER
BEETLES: The Coming Out
Students design an experiment to test the variables involved in the hatching of the Bruchid beetle.
Curated OER
Schoolyard Bird Project
Middle schoolers observe and count bird sightings around their schoolyard throughout the school year.
Curated OER
Make a Frequency Table and a Histogram for a Given Set of Data
In this data recording and data organization activity, students create one frequency table and one histogram for a given list of data. Explanations and examples for frequency tables and histograms are given.
Curated OER
The Hot Dog Stand - An Annual Report
Middle schoolers run a computer simulation and collect data as they work and use the data to create an annual report for their business. It is desirable for students to do this project individually, but it could be done as a class using...
Curated OER
Finding Equations
Students make equations from everyday data. They create a graph from the equations. Students predict and analyze the results. Students complete the second scenario on their own and turn in their handout.
Curated OER
How can my breakfast help the birds?
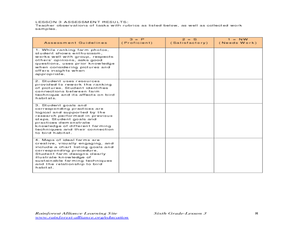
Sixth graders design farms with a bird's habitat in mind. In this farm lesson plan, 6th graders research how sun grown coffee destroys a bird habitat, and then they make their own farm with a bird's habitat being preserved. They then...
Curated OER
The Mysterious Plant Caper
Students investigate the basic parts of plant and that plants are living things which require water, air, light and nutrients for survival. They do this through a series of scientific experiements and multi-curricular hands-on activities.
Curated OER
Tag It and Bag It: Archeology Lab Lesson
Seventh graders practice analyzing, collecting and categorizing artifacts. Using charts, they organize and interpret information about the artifacts they classified. They work together to create a graph to represent class totals and...
Curated OER
Cloud Observation and Graphing
Students identify the three major cloud groups. They are introduced to the three main cloud types and spend a week making and recording observations of clouds. Students produce a graph that presents their findings and conduct research...
Curated OER
Flying High in Math
Seventh graders study how real airplanes fly and then they construct models of paper airplanes using design resources for the Internet and their own design. They use meaurement and caluculations in order to help them construct their...
Curated OER
Using Statistics to Uncover More Evidence
Fifth graders participate in an online Web lesson plan on ways of interpreting data. They conduct a survey and interpret the results in a journal entry.
Curated OER
Closing the Case
Fifth graders collect data and prepare data displays using a survey with statistical information.
Curated OER
Understanding Cloud Formation
Pupils explore air and clouds by watching demonstration. They perform an experiment to measure air pressure changes.
Curated OER
Twisters
Students differentiate between the terms 'tornado watch' and 'tornado warning' and simulate the conditions that produce tornadoes. They read "Night of the Twisters" by Ivy Ruckman and conduct an experiment using two-liter plastic...
Curated OER
Cloud Shadows
Students classify clouds as transparent, translucent or opaque. They conduct an experiment to determine the visual opacity of several classroom objects and then conduct further observations of clouds.
Curated OER
Graphing Data - Temperature
Seventh graders measure and record temperature over a given time period. They compare the recorded temperatures to the 40-year recorded normal average temperatures for the same area. Students display and interpret their findings in a graph.
Curated OER
TE Lesson: Caught in the Net
Young scholars student the concept of bycatch, the act of unintentionally catching certain living creatures using fishing equipment. They determine the difference between bycatch and target creatures. They discover what species become...


