Curated OER
Regents Exam Questions: Distance
In this distance worksheet, students solve 12 multiple choice, short answer, and graphing problems. Students use the distance formula to find the distance between two points.
Curated OER
The Shortest Line Mystery
Students calculate the shortest distance of various scenarios. In this algebra lesson, students interpret graphs of optimization problems. They use a graphing calculator to assist them in graphing and making predictions.
Curated OER
Point Graphs
Students experiment with point graphs. In this math instructional activity, students are divided into groups and perform an experiment to see how high a ball bounces, recording their results on a point graph. Students then answer...
Curated OER
Graphing Integers
Fifth graders complete an integer graphing activity. In this integer graphing instructional activity, 5th graders use coordinate grids to help them complete linear functions and integer graphing.
Curated OER
Graphing Nonlinear Equations
Students graph non-linear equations. In this algebra lesson, students investigate different polynomial functions and their shapes. They identify the different powers and zeros.
Curated OER
Slopes and Lines
Students identify the slopes of a line. In this algebra instructional activity, students calculate the slope and intercept of a line. They graph their lines using a TI calculator.
Curated OER
Linear Graphs and Equations
In this linear graph and equations worksheet, students calculate the gradient of slopes, and find equations of lines in patterns.
Curated OER
Using Graphs
In this using graphs worksheet, 9th graders solve and complete 6 different types of problems. First, they determine how the transformation shown moves the graph. Then, students find the interval that is defined given the coordinates....
American Statistical Association
Scatter It! (Using Census Results to Help Predict Melissa’s Height)
Pupils use the provided census data to guess the future height of a child. They organize and plot the data, solve for the line of best fit, and determine the likely height and range for a specific age.
Balanced Assessment
A Fishy Story
There's nothing fishy about this resource. In the task, learners use given information about fish prices to create a scatter plot and line of best-fit. Later, they use the information to answer questions about the profit from fish sales.
Curated OER
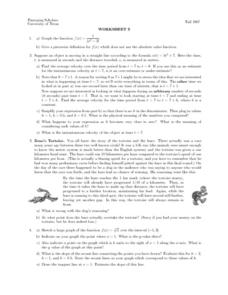
Worksheet 3 - Velocity, Movement
In this velocity worksheet, students determine the distance traveled when an object is moving in a straight line. Students graph functions and determine the slope of the line. This two-page worksheet contains six multi-step problems.
Curated OER
Graph Those Stickers!
Students graph fruit. For this graphing lesson students create a graph using fruit label stickers. Students place a sticker on the graph when the fruit has been consumed.
Curated OER
Position and Velocity vs. Time Graphs
In this position and velocity worksheet, students sketch graphs of position vs. velocity and position vs. time for 6 problems given different scenarios. They label their graphs with given positions, velocities and times.
Curated OER
The Slope of a Line
In this slope learning exercise, students examine graph and determine the slope of a line. They determine coordinates of a point to make a true statement. Students identify the dependent variable and the independent...
Curated OER
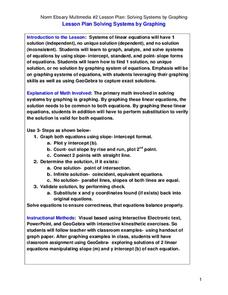
Solving Systems by Graphing
Students solve systems of equation through graphing. In this algebra activity, students solve linear equations and analyze the result to figure out if there is one solution, no solution or infinitely many solutions. They graph their...
Curated OER
Graphing Linear Equations
In this calculator active graphing worksheet, students graph 12 equations via a calculator and transfer the graphs onto coordinate grids.
Curated OER
Graphs
In this algebra worksheet, learners solve linear equations through graphing and quadratic equations through factoring. There are 4 questions dealing with systems of equations.
Curated OER
Graphing Speed
In this graphing learning exercise, students read about independent and dependant variables and learn how to determine speed from the slope of a position vs. time graph. This learning exercise has 4 matching, 17 fill in the blank, and 2...
Curated OER
Graphing Speed; Slope
For this graphing speed worksheet, students find the slope in a position vs. time graph to be the speed. They are given example graphs of position vs. time to show the changes in slope reflect the changes in speed. Students match terms...
Curated OER
Coordinate Geometry
In this geometry worksheet, students solve and graph points on coordinate plane. They write the equation of a line and describe the line's position on a coordinate plane. There are 9 questions with an answer key.
Curated OER
Circles and Parabolas
In this circles and parabolas worksheet, students follow directions to draw parabolas. They fold paper to represent a parabola. Students also use straight lines to create a circle. This one page worksheet contains three multi-step...
Mathematics Vision Project
Module 6: Trigonometric Functions
Create trigonometric functions from circles. The first lesson of the module begins by finding coordinates along a circular path created by a Ferris Wheel. As the lessons progress, pupils graph trigonometric functions and relate them to...
Curated OER
Stars and Slopes
More of a math lesson than physics or space science, high schoolers take a set of data and plot it on a log-log coordinate system. The write-up for day two was never completed, but day one, "Stars and Slopes," is complex and cohesive....
Concord Consortium
Function Project
What if a coordinate plane becomes a slope-intercept plane? What does the graph of a linear function look like? Learners explore these questions by graphing the y-intercept of a linear equation as a function of its slope. The result is a...


