Charleston School District
Increasing, Decreasing, Max, and Min
Roller coaster cars traveling along a graph create quite a story! The lesson analyzes both linear and non-linear graphs. Learners determine the intervals that a graph is increasing and/or decreasing and to locate maximum and/or...
Houghton Mifflin Harcourt
Integers, Opposites, Absolute Value
Straight from the pages of a math textbook, this three-lesson series introduces young mathematicians to the world of integers. Starting with a definition of integers and their applications in the real world, this resource goes on to...
Code.org
Sending Numbers
Binary graphing ... bit by bit. Pairs work together to develop a protocol in order to send the points of a graph. One partner sends the points and the other receives them and tries to recreate the graph. The pupils use the rubric to...
Education.com
Measure School Supplies
Ever wonder how long a pair of scissors are? Find out with this simple measuring activity in which pupils use the provided ruler to determine the length of four common classroom supplies.
Curated OER
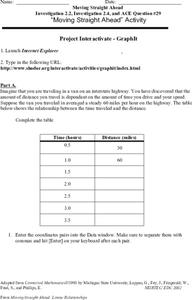
Moving Straight Ahead
In this functions learning exercise, 9th graders solve and complete 24 various types of problems. First, they complete the table with the correct distance for each hour given. Then, students enter the coordinate pairs into the function...
Curated OER
Worksheet 24
In this math worksheet, students work with three dimensional graphing. The application problems include surface ships on maneuvers determining a submarine's course, helicopter travel, and proving that four points are coplanar. Students...
Curated OER
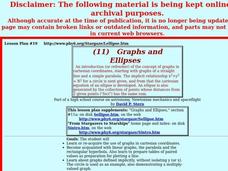
Graphs and Ellipses
Students explore linear graphs, the parabola and the rectangular hyperbola.
Curated OER
Linear Equations Data Tables
Students graph linear equations on a Cartesian plane. After describing data tables and their use, students explore how the information from a table can be used to create a line graph. They discuss reasons for plotting a minimum of...
Statistics Education Web
Walk the Line
How confident are you? Explore the meaning of a confidence interval using class collected data. Learners analyze data and follow the steps to determine a 95 percent confidence interval. They then interpret the meaning of the confidence...
PBS
Working with Coordinate Planes: Activities and Supplemental Materials
Seven activities make up a collection of supplemental materials to reinforce graphing on a coordinate plane. Worksheet objectives include plotting coordinates within single and four quadrants, measuring straight and...
Curated OER
Unit VII Energy: WS 1 Qualitative Analysis - Pie Charts
For each of eight diagrams of objects in motion, physics masters draw pie charts to depict the changes in energy. For each they must identify the energy conditions at each position. This is a unique worksheet, perfect for assessing how...
Curated OER
Doctor, Doctor, Give Me the News, I've Got a Bad Case of Loving Math
Solve a real-world problem of discovering how many doctors and nurses can be hired within budget and building constraints. Using different colored pencils to shade each graph, they then find the intersection points and use these to solve...
Curated OER
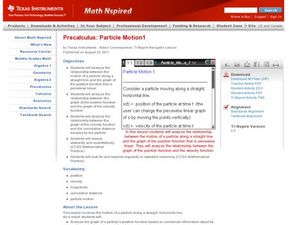
Particle Motion1
Students analyze piecewise functions. In this precalculus lesson, students identify the position, velocity and distance. They analyze the relationship between the graph, its position and velocity.
Curated OER
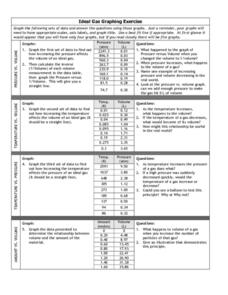
Graphing Exercise of Ideal Gas Data
In this graphing of Ideal Gas Data activity, students use the given data to draw 4 graphs of the given data. They are given the pressure and volume to draw and interpret the graphs.
Curated OER
Motion Musing
Students investigate graphing a line. In this algebra lesson, students collect data on the path of a skateboarder. They collect how fast the board is traveling along a straight line and graph their results.
Curated OER
Cool Cars
Students travel one at a time in a straight-line path and attempt to maintain a constant velocity. While one student walks, jogs, or runs, the other group members time the "runner" while standing at five-meter intervals along the path....
Curated OER
Inverse Functions
In this inverse functions worksheet, 9th graders solve and graph 10 different problems that include the inverse of various functions. First, they determine if the coordinates given is the inverse of a function given. Then, students use...
Curated OER
Domino Dash
In this speed worksheet, students use dominoes to measure the average speed of rows falling over. Students make a line graph to show the relationship between the length of the domino row and the time. Students answer 8 questions about...
Curated OER
Finding the Shortest Total Distance possible
In this geometry worksheet, students solve the problem of finding the shortest total distance traveling in straight lines. The solution is provided.
Curated OER
Graphing Inequalities
In this graphing inequalities worksheet, students create graphs of algebraic expressions containing inequalities. This two-page worksheet contains explanations and examples prior to the exercise. The first page is a contains...
Curated OER
Round and Round and Round We Go!
Students investigate motion using a CBL. In this algebra lesson plan, students collect and graph data on a coordinate plane. They define and identify amplitude and period of conic graphs.
Curated OER
Graphing Coordinates
Sixth graders practice graphing coordinates. In this geometry lesson, they use the x and y axis to locate points that must be connected in the right sequence to form a straight line.
Illustrative Mathematics
Robot Races
Analyze data on a graph to answer three questions after a robot race. Learners practice comparing ratios and reading points on a graph. Answers may vary on the last question based on accuracy of graphing. Use the lesson along with...
Mathematics Assessment Project
Middle School Mathematics Test 4
Raise expectations in your classroom and assess learners through the provided performance tasks. Class members must apply concepts learned throughout the year, providing a good measurement of how well they understand the...


