Curated OER
Graphs And Ellipses
High schoolers become acquainted with linear graphs, the parabola and the rectangular hyperbola. Also prepare tables of paired values as preparation for plotting a line. They study the cartesian equation of an ellipse, with a worked...
Curated OER
Exploring Geometric Patterns and Relationships
Sixth graders explore different geographic relationships in like drawing lines, rays, and parallelograms. This lesson could be used for review because it covers more than one concept. The students should have prior knowledge.
Curated OER
Tree Measurement
Students work in pairs taking measurements of a tree. They measure the trunk, crown, and height using vertical and horizontal measurement. Then students create a bar graph using the information they gathered.
Curated OER
Cost analysis
In this Algebra I worksheet, 9th graders analyze a problem in which basic assumptions must be made about cost and demand for the product or item. Students use a graph to make predictions and determine the best price at which to...
Curated OER
Investigation - Looking For Triangles
Seventh graders investigate a series of triangles, looking for patterns and generalizing what they have found. They analyze the pattern data and organize it into a table and graph. Students identify the relationship and discover the rule...
Inside Mathematics
Scatter Diagram
It is positive that how one performs on the first test relates to their performance on the second test. The three-question assessment has class members read and analyze a scatter plot of test scores. They must determine whether...
National Research Center for Career and Technical Education
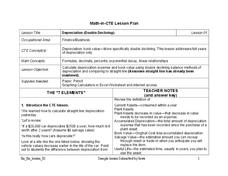
Depreciation (Double Declining)
Have you ever been told that your new car begins to lose its value as soon as you drive it off the lot? Aspiring accountants take on the concepts of depreciation and book value through an easy-to-deliver career and technology lesson. The...
EngageNY
Analyzing Residuals (Part 2)
Learn about patterns in residual plots with an informative math lesson. Two examples make connections between the appearance of a residual plot and whether a linear model is the best model apparent. The problem set and exit ticket...
Inside Mathematics
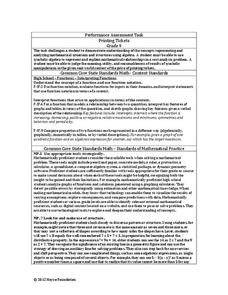
Printing Tickets
Determine the better deal. Pupils write the equation for the cost of printing tickets from different printers. They compare the costs graphically and algebraicaly to determine which printer has the best deal based upon the quantity of...
EngageNY
Increasing and Decreasing Functions 2
Explore linear and nonlinear models to help your class build their function skills. In a continuation of the previous lesson, learners continue to analyze and sketch functions that model real-world situations. They progress from linear...
Curated OER
Exploring Slope
In this exploring slope worksheet, students solve and complete 4 different problems. First, they compare an object's weight on Earth to an object's weight on another planet using the information given. Then, students compare this...
Curated OER
Tree Measurement
Measure a tree? Yes, measure a tree! Students get outside and measure a tree's trunk, crown, and height. Each group compares their answers to determine if any re-measuring is necessary. Once back in the classroom, students make bar...
Curated OER
Worksheet 15-Fall 1995
In this math worksheet students use the intermediate value theorem to solve two problems. They find parallel lines that will cut a convex shape into two pieces with equal areas. Students repeat this problem with a concave shape. Students...
WK Kellogg Biological Station
Plotting Phenology
Finally, a worksheet that involves more than filling in some blanks. Your budding ecologists must graph and analyze three sets of data, then synthesize the information as they think about the impacts of plant reproduction on insects and...
Curated OER
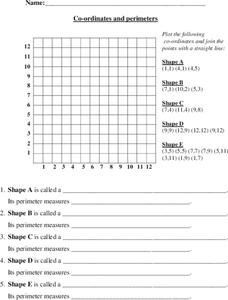
Coordinates and Perimeters
Here is a lesson containing a great activity based on coordinates, and the perimeters of shapes created using a given set of coordinates. After youngsters creat a shape on a grid based on some coordinate pairs, they must identify which...
Curated OER
Linear Equations and Their Graphs
In this Algebra I/Algebra II worksheet, students solve problems involving interpreting the slope of a linear equation as a rate of change. The two page worksheet contains a combination of seven multiple choice and free response...
Curated OER
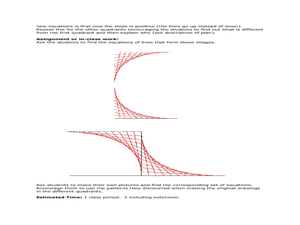
Mathematics of Doodles
Students use the slope and y-intercept to graph lines. In this algebra instructional activity, students graph linear equations and apply it to solving real life problems.
Curated OER
Scatter Plots
In this Algebra I/Geometry/Algebra II worksheet, students create a scatter plot and analyze the data to determine if the data show any type of correlation. The four page worksheet provides extensive explanation of topic,...
Curated OER
Trends in the Periodic Table
In this trends in the periodic table worksheet, high schoolers plot the ionization energy vs. atomic number and they plot atomic radius vs. atomic number of the first 20 elements. Students analyze their graphs and answer questions about...
Curated OER
Take a Walk
Sixth graders graph acceleration and practice using the metric system. In this physics activity, 6th graders take turns timing each other as they walk 15 meters. Students then chart and graph their data using the metric system.
Curated OER
Density of Pennies Lab
In this density of pennies worksheet, student conduct an experiment to determine the metals used in the core of pennies made after 1983. Students design their own experiments using a balance and graph paper to determine the density of...
Curated OER
Walking the Plank: Student Worksheet
In this math worksheet, students will work in a group to experiment with the weight of objects when placed at a distance from a scale (using a plank). Students will record and graph their results.
Curated OER
A Simple Thermoetric Titration
In this thermometric titration worksheet, students investigate the changes in temperature when an alkali is neutralized by an acid. Students graph their results from the titration and draw 2 best fit lines on their graph. Where the lines...
Curated OER
The Big Bang-Hubble's Law
In this Hubble's law activity, students use data for galaxies which include their distance and speed. Students make a graph to show the distance to each galaxy and the speed of each galaxy. They use their graph to answer 4 questions...


