Curated OER
Systems of Linear Equations
Learners use the calculator to represent a situation as a table, graph, and equation. They write systems of equations and find solutions to systems of equations. In addition, they explain and justify how they determined their
solutions...
Curated OER
Spaghetti Bridges: Student Worksheet
In this math worksheet, students will create a "bridge" out of spaghetti and test it's strength with pennies. Students will record their results on a table and then graph the results.
Curated OER
Systems of Linear Equations - Standard Form
Young scholars write systems of equations and find solutions to systems of equations. They explain how they determined their solutions to a system of equations and justify their solutions. In addition, they write equations in standard...
Curated OER
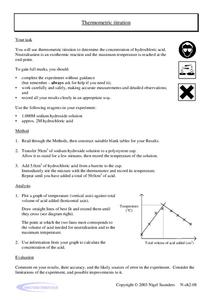
Thermometric Titration
In this thermometric titration worksheet, students titrate hydrochloric acid with sodium hydroxide to determine the concentration of hydrochloric acid. They measure the change in temperature of the solution, plot their data and use the...
Curated OER
Ready, Set, Go!
Students predict if the height of a ramp affect how far an object travels. They design and conduct an experiment to test their predictions. The results are recorded and a graph is created to show the relationship between ramp height and...
Curated OER
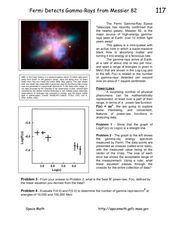
Fermi Detects Gamma-Rays from Messier
In this power law function worksheet, students use data from the Fermi Gamma-Ray Space telescope to apply the power law function to physical phenomena. Students use a graph to solve four problems.
Curated OER
Super-Ball Physics
Students experiment with varied balls to determine the bounce factor in centimeters. In this physics lesson, students experiment to find the height a ball must be dropped from the have the highest bounce rate. Students graph the results...
Curated OER
Flight of Angles of Inclination
Students measure the flight of a gilder. In this fight of angles lesson, students explore the flight of a glider and measure the distance flown. They collect statistical data of the flights and determine the slope of each flight. ...
Curated OER
Walking the Plank
Eighth graders experiment with a bathroom scale, books and a plank to determine how weight readings change as distance is applied. They graph and interpret the results.
EngageNY
Searching a Region in the Plane
Programming a robot is a mathematical task! The activity asks learners to examine the process of programming a robot to vacuum a room. They use a coordinate plane to model the room, write equations to represent movement, determine the...
Balanced Assessment
Red Dots, Blue Dots
Count the connections between dots. Young mathematicians come up with a method to determine the number of connections between pairs of dots. The assessment leads the class to determine the connections they can make when groups are...
Curated OER
The Point Line - Teaching Patterns
Students practice extending patterns. In this patterns lesson, students demonstrate extending patterns by performing a rhythmic patter.
Curated OER
I'm Inclined to See; Physics, Math, Science, Experiments, Graphs
Students discover the motion of a sphere on an inclined plane and discover basic relationships involving distance, time, speed(velocity), and acceleration.
Georgia Department of Education
Math Class
Young analysts use real (provided) data from a class's test scores to practice using statistical tools. Not only do learners calculate measures of center and spread (including mean, median, deviation, and IQ range), but...
Curated OER
Linear and Nonlinear Functions
Students identify properties of a line. In this algebra lesson, students differentiate between functions and nonfunctions. They use the slope and y intercept to graph their lines.
Curated OER
The Proof
Young scholars will construct simple curves on graph paper by connecting a series of points between the vertical and horizontal axes. They share their designs and explain the patterns.
Curated OER
Generate an Accurate Landscape Profile from a Topographic Map
Students enerate an accurate landscape profile from a topographic map. They determine the correct interval needed to accurately graph the change in elevation on a single piece of graph paper.
Curated OER
Systems of Equations
Students solve systems of equations. In this algebra instructional activity, students use elimination and substitution to solve for the point of intersection. They use graphing to see where the two lines intersect.
Curated OER
Interpreting Data
For this interpreting data worksheet, students solve and complete 4 different types of problems using different data types. First, they collect raw data from a paragraph shown. Then, students identify the examples of two different types...
Curated OER
What's The Point?
Students solve word problems using the correct math symbols. In this algebra lesson, students use the TI calculator to graph their equation and analyze it. They find the line of regression and use to draw conclusion.
Curated OER
Linear Functions
In this linear function worksheet, students write the equation of a line, identify the slope, distance and midpoints. This one-page worksheet contains seven problems. Answers are provided at the bottom of the page.
Curated OER
Spaghetti Bridges
Eighth graders experiment with building bridges of spaghetti, pennies, and a cup to determine how varying the number of spagetti pieces affects the strength of the bridge. They graph their results and interpret the data.
Curated OER
Polynomial Functions
Students explore polynomial functions. In this Algebra II lesson, students explore graphs of polynomial functions as classify the functions as linear, quadratic, cubic, or quartic. Students determine the regression equation...
Curated OER
Population Biology
For this population worksheet, students will compare two graphs; one graph representing steady rate of growth and the other one showing exponential growth. Students will use these graphs to complete 3 short answer questions.


