Curated OER
Plotting the Ocean Floor
Fourth graders plot points on a graph, connect the dots to make the ocean floor profile and label the topographical features. They utilize a worksheet and a website imbedded in this plan to plot the ocean floor.
Curated OER
Worksheet 11
In this math worksheet, students find the vector parametric equation and symmetric equations for the line using two coordinate points.
Curated OER
Transformations
Sixth graders discover transformations. In this graphing lesson plan, 6th graders explore visual examples of plotting transformations as they review translations, rotations, and reflections. Students also practice solving problems that...
Curated OER
Inverse Relations and Functions
In this algebra worksheets, students find the inverse of a given function by switching the y with the x. They graph the different functions and identify the difference. This worksheet includes thoughtful questions and worked examples.
Curated OER
Prime and Composite Numbers, Prime Factorization
Students research prime and composite numbers. With a partner, students use graph paper to draw rectangles of various sizes. They list the dimensions of rectangles and discuss how the dimensions relate to the factors of each number....
Curated OER
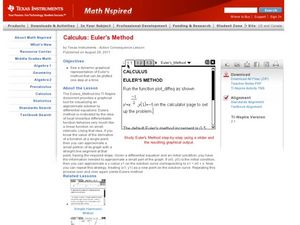
Euler's Method
Learners identify Euler's method of graphing in this calculus lesson. They approximate values of a function and check their work using EM. They also differentiate equations at an exact point.
Curated OER
Building a Rover
Students investigate properties of lines and points by making a rover. In this algebra lesson, students plot points correctly on a coordinate plane. They identify coordinate pairs given the plots and lines.
Curated OER
Friction of a Block Weight
Fifth graders hypothesize and design an experiment to study the relationship between a block weight and the number of washers it takes to pull a block across various surfaces. Students graph results and apply their findings to a...
Curated OER
Perimeter of Polygons
Eighth graders discuss perimeter by relating it to the path they would take while walking their dog around a park. They find the perimeter of regular polygons and one irregular polygon. Students use graph paper to draw their own examples...
Curated OER
Motion
For this motion worksheet, students will read 8 statements about displacement and velocity and determine if the statement is true or false. Then students will fill in the blank for 8 statements on motion. Finally, students will compare...
Curated OER
Real World Systems of Linear Equations
Students solve systems of equations with fluency. In this algebra lesson, students graph, use elimination and substitution to solve systems of equations. They identify the point of intersection using algebra.
Curated OER
Who's the Frog Jumping Champion?
Students use a simple machine (a lever) to launch a plastic frog. students determine who is able to make their frog "jump" the farthest and graph the results.
Curated OER
Choosing a Summer Job
What did you do over your summer vacation. Young wage earners must compare summer job options, and determine when each job earn the same amount and what that amount be. This be done by creating, graphing, and solving systems of...
Curated OER
Hit or Miss
In this hit or miss activity, students play a game called hit or miss where they draw points on a graph and their partners have to guess where their points are. Students each get a grid and play a game representing battleship.
Curated OER
It's a Drag!
Students create number lines using decimals and whole numbers. In this algebra lesson, students graph and solve linear equations. They plot ordered pairs on a coordinate plane correctly.
Curated OER
Describing the Motion of a Battery Powered Cars
Students explore distance a toy car travels by changing the amount of batteries used to power the toy car. In this force and motion lesson, students calculate the average speed of a car while investigating the power from various...
Curated OER
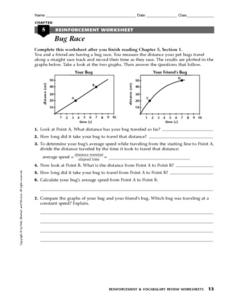
Bug Race
For this motion worksheet, learners compare two graphs showing a bug's distance traveled over time. Students calculate the average speed of the bugs and determine which bug was traveling at a constant speed. This worksheet has 1 short...
Curated OER
Analyzing Motion of a Tossed Ball
Students investigate the parameters involved with launching a basketball at an angle. In this motion lesson students predict and sketch graphs that show the motion of a ball toss.
Curated OER
Variation
In this variation worksheet, students interpret and organize data. They find the distance between points. Students use ratios to determine volume This six-page worksheet contains approximately 20 problems. Answers...
Curated OER
Math Morphing Proximate and Evolutionary Mechanisms
Students identify the different types of fractals. In this geometry lesson, students use math to analyze different biological phenomena. They collect data from the experiments and construct graphs.
Curated OER
Creating The Blueprints
High schoolers engage in a lesson in order to create blueprints to design an original floorplan. They use graphing paper and drawing tools to demonstrate knowledge of the lesson objectives. Students label and use the right kind of...
Alabama Learning Exchange
The State Capital of Stem and Leaf
Students explore the concept of stem and leaf plots. In this stem and leaf plots lesson, students plot the 50 US states' capitals on a stem and leaf plot according to the first letter of each state. Students compare...
Curated OER
My Peanut Butter is Better Than Yours!
Students explore the concept of statistical data. In this statistical data lesson, students read an article about the dangers of peanut butter to those who are allergic. Students perform a taste test of two different brands of peanut...
Curated OER
How Chess Pieces Move
In this how chess pieces move activity, 6th graders read how all of the chess pieces move, then answer one question about the moves of the rook using a grid.


