Curated OER
Surveys and Graphing
First graders survey different classrooms to determine types of products students would like to see sold at school, and create graphs based on survey results.
Curated OER
Survey Says...
Young statisticians collect, organize, and present data to illustrate responses to a survey question. They write and conduct the survey. They finish by presenting the results in the form of a graph.
Google
Graphing with Google Docs & Forms
Get to know your class and teach about data analysis all with the help of Google Docs. Using student-generated questions, create a class survey using Google Forms. Reserve time in the computer lab for learners to complete the form and,...
Curated OER
And the Survey Says...
Create a survey and graph! In this graphing lesson, learners listen to a story about pets, create a survey for family and friends about what pets they own, and use the information to create a bar and line graph.
Curated OER
Tall Tale Rollers
Students explore American tall tales. In this tall tale lesson, students discover the six characteristics that are included in tall tales. Students survey their class to find each student's favorite tall tale character and organize the...
US Department of Commerce
The Place of My State
State the population of the state. Pupils research census data on the total population, the number of children their age, and the number of children of the same age and gender in their states. They write these numbers in standard,...
Curated OER
Beatrix Potter Book Survey
In this survey activity, students ask classmates which Beatrix Potter books they have read and record their responses. Book titles are listed in the first column and tally marks are written in the second column. Students then graph the...
Curated OER
ESL: Classmates Survey
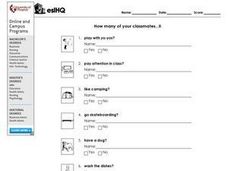
Get your beginning English Learners moving with this class survey. They ask each other the 8 questions provided to find out "How many of your classmates..." Good practice for asking questions that start with"Do you..." including "make...
Curated OER
Ice Cream
Students explore the concepts of mean, median, mode, and range as they elicit data about people's favorite flavor of ice cream. A practical application of the data obtained offers an extension to the lesson plan.
Curated OER
Survey Project
Eighth graders create a website using FrontPage. They use inserted forms to collect survey information and use Microsoft Excel and MS Word to create a presentation of the survey and the results.
Curated OER
Local Traffic Survey
Young scholars conduct a traffic survey and interpret their data and use graphs and charts to display their results.
Curated OER
ESL- Taking a Classroom Survey
In this ESL classroom survey worksheet, students determine which of their classmates do things such as play with yo-yo's, pay attention in class, like camping or go skateboarding. They look at small clip art pictures of the activities to...
Curated OER
ESL How Many of Your Classmates... IV Survey
In this ESL classroom survey worksheet, students determine how many of their classmate like or do the listed things. They ask classmates 8 questions such as: do they like pizza, go to school by bus, or go in-line skating.
Curated OER
Favorite Food Survey Recording Sheet
In this favorite food survey recording learning exercise, students use the survey sheet to collect data about favorite foods. They fill in the name and favorite food of the people they survey.
Curated OER
Survey: What is Your Favorite Rainforest Animal?
In this favorite rainforest animal survey worksheet, 1st graders will survey their classmates about which animal is their favorite. There are 12 animal choices. Students will record responses by making tally marks.
Curated OER
Favorite Animal Survey --Animals of Australia
For this favorite animal survey worksheet, learners use tally marks to survey and record data about favorite Australian animals. Students then use the results to make a graph.
Curated OER
Graphing Surveys and Analyzing Data
Students analyze data and graph the results of their surveys. In this statistics lesson, students create graphs using excel to make graphs to be able to better observe their data. They conclude how great we as unique individuals.
Curated OER
Tally Marks
For this mathematical worksheet, students practice mastering the concept of keeping up with tally marks in a variety of activities. Students complete a survey involving tally marks.
Curated OER
Hearing Handicap
Students examine the effects of hearing loss. In this lesson on physical disabilities, students survey five older adults on hearing impairments. Students pool their data and compare their results with the results from other studies about...
Curated OER
To Get the Right Answers about College: Ask the Right Questions
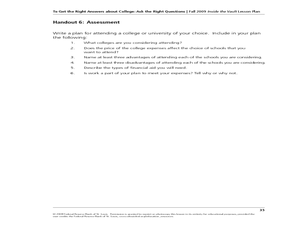
High schoolers survey college students. In this lesson, high schoolers explore typical costs. They examine education loans. Students complete a FASFA form and write an essay describing plans for obtaining money for college expenses.
Curated OER
Our Pets
In this graphing worksheet, students survey their classmates about what pets they like. Students record the data in the form of a bar graph. There are 8 choices listed.
Curated OER
Survey Says
Students complete a survey questionaire and total the responses. They create a game like Family Feud with the top answers. They create a bar graph of one of the questions after the game is finished.
Curated OER
A Thanksgiving Survey
Students conduct a survey. In this math lesson, students design and conduct a survey about Thanksgiving foods. Students display the collected data in a graph and use the graph to determine what food to serve for a Thanksgiving meal.
Curated OER
Graphing in the Form of Bar Graphs
Young scholars explore bar graphs. In this math lesson, students create and conduct a survey. Young scholars graph their data in a bar graph.


