Willow Tree
Data Sampling
Some say that you can make statistics say whatever you want. It is important for learners to recognize these biases. Pupils learn about sample bias and the different types of samples.
Federal Reserve Bank
The Fed Is Protecting Your Money
A dollar bill, a check, a credit card, and... a cow? What exactly are the various forms of payment that exist today? Your learners will identify the three functions of money in this lesson. In addition, they will discover the most common...
EngageNY
Summarizing Bivariate Categorical Data in a Two-Way Table
Be sure to look both ways when making a two-way table. In the lesson, scholars learn to create two-way tables to display bivariate data. They calculate relative frequencies to answer questions of interest in the 14th part of the series.
Messenger Education
Exploring Exploring
The reason people first began trading was because of their desires for objects other societies possessed. In the activity, classes discuss why exploration has been a common thread in all societies and where these desires have taken...
Curated OER
Take a Survey!
Second graders discuss proper uses of the Internet. They complete the 8-question survey by selecting their favorite answer for each question. They click one time in the white circle to choose an answer and click Next at the bottom on...
Curated OER
Home Survey: What Kind of Energy?
In this environmental awareness worksheet, students become aware of home energy conservation and recycling. Students answer 10 short essay questions about the energy used in daily life.
Curated OER
Web Research Helps Students Choose Classroom Pets
Students interview different teachers in their school. They decide which pet would fit best in each classroom. They share the information they gathered with the class.
Curated OER
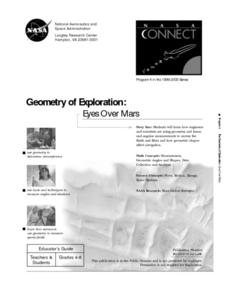
Geometry of Exploration: Eyes Over Mars
Students research how engineers and scientists generate linear and angular measurements with geometry to survey the Earth and Mars. They assess how geometric shapes affect navigation. A surveyor comes to the classroom and explains how he...
Curated OER
Roaring Twenties: The Impact of High School on its Students Over Time
Eleventh graders compare the American high school experience of the 1920's to today. In this historical perspectives lesson, 11th graders examine surveys from 1924 high school students and then create their own surveys for today's high...
Curated OER
National Dictionary Day
In this National Dictionary Day activity, students complete activities including reading a passage, matching phrases, fill in the blanks, correct word choosing, multiple choice, sequencing, unscramble the sentences, write questions, take...
Curated OER
I Spy
Students examine the responsibilities of the CIA and work as a team of analysts to produce intelligence reports. Letters are written predicting how their assigned countries have changed by 2008.
Curated OER
If You Were a Community Helper for a Day, Which One Would You Like To Be?-- Class Bar Graph
For this math worksheet, learners collaborate to make a class bar graph. Students choose from a list of 12 occupations they are interested in and plot the information on the graph.
Curated OER
Pizza, Pizza
Learners survey community members to determine their favorite pizza toppings and create a bar graph to show their findings. In this probability and statistics lesson, students collect data by conducting a survey. They analyze the data,...
Curated OER
Maggie, Maggie
Students read Maggie, Maggie by Beverly Cleary. In this Maggie, Maggie lesson students develop strategies for understanding vocabulary in the story. Students survey the number of left and right handed students. Students write and...
Curated OER
All About Graphs
Students practice organizing data by creating graphs. In this statistics lesson, students survey the class about favorite colors and create a bar graph using the data. Students complete a test based on pet and animal statistics.
Curated OER
Civil Rights
Twelfth graders survey how controversial court cases have changed the viewpoints of civil rights. In this U.S. Government lesson, 12th graders work in small groups to prepare summaries of specific court cases, then present their...
Curated OER
Children's Book Creations
Students create a children's book version of the Japanese folk story "Momotaro Boy of the Peach" and present the story to elementary students. In this children's book lesson, students design their book to explain Japanese culture to...
Curated OER
Composting
Students survey what composting is. They observe the benefits of composting over the course of the school year by making your own composters and gardens. Group members compare two different compost piles, make conclusions about...
Curated OER
What is the Nature of Science?
Conduct a survey about the nature of science with your high schoolers. They will record their responses in a table and then discuss the implications of scientific theory. Note: There are activity sheets, and forms included with this...
Curated OER
It's Time to Wrap-Up the School Year!
As the school year rapidly comes to a close, don’t forget to collect feedback to improve your teaching.
Henry Ford Museum
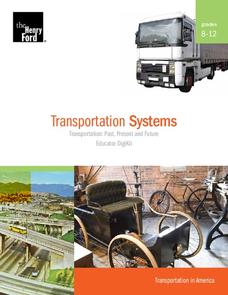
Transportation Systems
Learners analyze the evolution of cultural attitudes through the lens of transportation, examining several artifacts, documents, and photographs. Topics covered include how American attitudes have influenced society's evolution into a...
Curated OER
Junk Food Jungle
Young scholars become familiar with the nutritional value of foods advertised on television and in magazines. They discuss different types of foods and where snack food fits into a healthy diet. They categorize the foods they eat as...
Curated OER
Candy Bar Survey
Second graders investigate the skill of graphing data by using candy bars to create context for the lesson. They use technology for graphing and organizing information like a spreadsheet. The lesson includes a resource link to aid in the...
Curated OER
A Thanksgiving Survey
Students conduct a survey. In this math lesson, students design and conduct a survey about Thanksgiving foods. Students display the collected data in a graph and use the graph to determine what food to serve for a Thanksgiving meal.


