Shodor Education Foundation
Introduction to the Concept of Probability
Acquaint mathematicians to the concept of probability with a discussion about the results of a game. Then have them play a dice, card, spinner, or coin game and recording the number of wins vs. the number of tries on an interactive web...
Math Worksheets Land
Patterns of Association (Using Data Table) - Matching Worksheet
This resource is the last of a four-part series that practices calculating percents based on data represetned in tables. This page has four multiple choice problems that analyze the data tables to answer a question.
Curated OER
Data Analysis: Graphs, Charts, Tables, Statistics
In this data analysis worksheet, students interpret data in 5 problems involving graphs, tables, and scatterplots. Students construct 1 stem and leaf plot and find the mean, median, and mode of a data set.
Curated OER
Make a Frequency Table and a Histogram for a Given Set of Data
In this data recording and data organization worksheet, students create one frequency table and one histogram for a given list of data. Explanations and examples for frequency tables and histograms are given.
Curated OER
Eye Color
Young scholars take a survey on eye color and plot their findings into a graph. In this eye color lesson plan, students take a class survey of everyone's eye color and learn how to put those findings into a graph.
Curated OER
Education for Global Peace
Students survey the class and graph the results. In this graphing and data collection lesson, students conduct a survey to see where their shirts were produced. Individuals use software to graph the results and create a written...
Curated OER
Follow the Pattern
Students survey patterns and relationships and then predict outcomes in real-world situations.
Curated OER
Data Collection and Presentation
Students concentrate on discrete quantiative data. They are shown that the vertical line diagram as a more appropriate way to present discrete quantiative data then bar charts. Students work as a group to help with the interpretation...
Curated OER
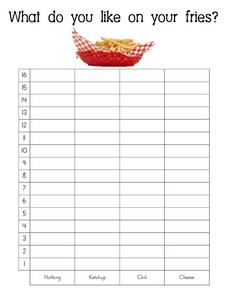
What Do You Like on Your Fries?-- Class Bar Graph
In this math worksheet, students participate in a group graphing activity. Students are surveyed about what they like on their fries: nothing, ketchup, chili or cheese. Results are plotted on a bar graph.
Environmental Protection Agency (EPA)
How Much Water Do You Use?
Incorporate reading strategies, math, research, and the scientific method into one lesson about water conservation. After reading a story about a landlady trying to determine how many people are living in an apartment, learners develop a...
Curated OER
19 Chains and 50 Links
Students investigate surveys as it relates to chains and links. In this math instructional activity, students relate math to history and surveys done above, below and on the earths' surface. They review vocabulary pertaining to this...
Curated OER
Classy Fractions
In this fractions worksheet, students find the total numbers of students in their class and ask each student 7 questions provided. Students make a tally chart to record the responses and calculate the fraction of the class that answered...
Curated OER
Charts and Graphs
Fifth graders interpret data into graphs and percentages. In this organizing data lesson, 5th graders discuss bar, circle and line graphs. Students complete bar graph and apply probability using the results.
Curated OER
Navigating by the Numbers
Students observe how math is important in navigation and engineering. They study how surveyors use math and science to calcute, count, measure, label, and indicate distances on a map. They estimate specific distances.
Curated OER
Leveled Problem Solving: Experimental Probability
For this using probability to solve word problems worksheet, students use statistics, averages, and even numbers, to problem solve. Students solve six problems.
Curated OER
Graphing Data
Second graders graph data about their classmates. For this data analysis lesson, 2nd graders ask each other several questions about their hair color and eye color. Students graph the data that they collected.
Curated OER
What Do You Like To Do the Most After School?-- Class Bar Graph
For this math worksheet, students collaborate to make a class bar graph which will display data on favorite leisure time activities. Students survey their classmates and plot the results on the graph. Six choices are given: games, read,...
Curated OER
How Do You Like Your Sandwich? --class Bar Graph
In this math worksheet, students participate in a group bar graph activity. Students survey their classmates on favorite sandwich choices: peanut butter and jelly, grilled cheese or meat. Results are plotted on a bar graph.
Curated OER
How Many Days Did It Take for Your Bean Seed To Germinate?--class Bar Graph
In this math/science worksheet, students collaborate as a class to create a bar graph which displays the germination time for bean seeds. Students survey their classmates and plot results on a graph.
Curated OER
Trumpet of the Swan Favorite Character Graph
In this math and literature worksheet, students survey classmates about their favorite character in the book Trumpet of the Swan. Students display the data on this blank bar graph.
Curated OER
Favourite Colours
In this colors instructional activity, students survey 20 people on what their favorite color is. They mark the results using tallies. Students then take their data and put the totals in a frequency table.
Curated OER
Every Vote Counts Lesson Plan
Students conduct weekly opinion polls or surveys about topics that are important to classmates. Using the information gathered, they design a bulletin board display. On the display, they show the poll questions, the names of the groups...
Curated OER
Look Into My Eyes!
Students explore collecting, analyzing, and graphing information. They collect data on the various eye colors of their classmates. Students tally the results and create a graph.
EduGAINs
Introduction to Solving Linear Systems
Word problems offer class members an opportunity to learn the concept of solving linear systems using graphs. Individuals choose a problem based upon preferences, break into groups to discuss solution methods and whether there is...


