Curated OER
The Ides March On - Caesar Today
Students make connections between the rule and reign of Julius Caesar and the leaders of other countries. They then create a news show that communicates their understanding of four essential questions that are included in the lesson.
Curated OER
Postcards from California: A Unit on Geography, Social Studies, History and California's Resources
Fourth graders examine patterns that influence population density in the various regions of California. The unit's three lessons utilize graphic organizers for the interpretation and presentation of data.
Curated OER
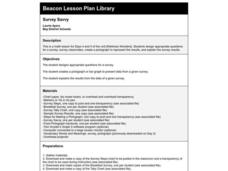
Survey Savvy
Third graders design appropriate questions for a survey, survey classmates, create a pictograph to represent the results, and explain the survey results.
Curated OER
How Different Are We from Other Students?
Fifth graders make bar graphs from data that they have collected. They have been writing to pen pals in Spain for a couple of months and received a survey back from them. They put all the data together that they collected.
Curated OER
The Household Environment Survey
Students examine data collected from a national survey of household environmental practices to develop their own questionaires. Once they have their own survey questions, students conduct their own investigations, and report their findings.
Curated OER
Manatee Awareness Survey
Students examine the public's awareness of manatees by taking a survey. They display the results of the survey as a graph.
Curated OER
Students Speak Up
Students share the ways they use technology at school and at home. In groups, they discuss how their study of math, science and technology is helping to prepare them for future jobs. They share their findings with the class and develop...
Curated OER
Learning, Communication, and 21st Century Skills: Students Speak Up
Students brainstorm to come up with examples of things they do with computers and write them down for the class to observe. They then raise their hands to respond to each survey question, tallying their answers on the board and engage in...
Curated OER
Inventors Unit Survey
Students develop and conduct a survey for their inventors unit. They create a five question survey and tally the survey results, and create a graph using Microsoft Word and Graph Club 2.0.
Curated OER
Create a Survey and Analyze the Data
Eighth graders create their survey discussing wording used in surveys and try to create one that is unbiased. They distribute the survey to the middle school but not during instructional time. They then collect and analyze the data...
Curated OER
Survey Says
Students complete a survey questionaire and total the responses. They create a game like Family Feud with the top answers. They create a bar graph of one of the questions after the game is finished.
Curated OER
Water Survey
Students investigate water usage for the average home with the help of conducting a home survey. The information is collected and organized into a graphic format. Then they analyze the results to formulate an educated opinion about water...
Curated OER
Surveying Our Media
Students participate in a lesson that is concerned with the concept of examining the use of media in society. They create surveys to measure the presence of the media in everyday life. The results are collected and represented in the...
Curated OER
Surveying During a Basketball Game
Tenth graders conduct a survey at a high school basketball game. They compile and present the data as histograms or bar graphs.
Curated OER
Pedestrian Safety for Students Lesson 4: A Walkable Survey
Students create a survey. In this survey lesson, students use www.walktoschool.org to help them come up with questions to ask other students. They put the information in spreadsheet format.
Curated OER
Climate and Periodic Functions: Science & Math Integration
Students complete a lab that introduce the scientific concept of climate on Earth. Following the lab, they complete further research on climate. Using average monthly temperatures students construct a mathematical model and analyze the...
Curated OER
A Ststistical Study on the Letters of the Alphabet
In this Statistics and Probability learning exercise, learners create a line plot for the first 100 letters in the Preamble to the constitution and compare their frequency distributions to the actual frequency distribution. The one page...
Curated OER
Math & Social Science
Students are given data and are to calculate averages and yearly totals of how many cars travel the Tacoma Narrows Bridge. They also make a graph of the data.
Curated OER
Data! Data! Graph that Data!
Fifth graders create data graphs using Microsoft Excel. In this data collection instructional activity, 5th graders create and conduct a survey, then use Excel to organize and graph their data.
Curated OER
Opinions, Please!
Students discuss the meaning and purposes of polls and surveys. After reading an article, they analyze the results of a poll given to residents of New York City. They create a survey of their own and analyze the data to write a written...
Curated OER
Interpreting Data and Statistics
Students define random sample and complete surveys. In this algebra lesson plan, students create surveys and define the way people analyze these results. They discuss random sample as it relates to the Great Depression and come up with...
Curated OER
Bits and Pieces - More About Percents - Online Manipulatives
In this online percentages worksheet, students access the Library of Virtual Manipulatives web site and open the percentage tool. They use the online tool to complete 8 multi-step questions making graphical representations and finding...
Curated OER
Plot Your Course
High schoolers determine distance and direction on a nautical chart. In this nautical instructional activity, students identify obstacles and characteristics of common aid to navigation on a nautical chart.
Curated OER
Calculating Theoretical & Experimental Probability
Students collect data by conducting a survey of fellow classmates. They investigate the relationship between estimates obtained from samples and theoretical probabilities. Answer keys included.


