Curated OER
Chocolate Preferences Voting and Graphing Techniques
Students practice sampling and graphing techniques. In this data collection and interpretation instructional activity, students write and conduct surveys about chocolate preferences and then collect their data. Students graph the data in...
Curated OER
Mathematical Explorations of the People’s Design Award
Students conduct surveys using nominees from the People’s Design Award, analyze data, and present the results using a pictorial representation. In this lesson, students will then design their own contest and mathematically determine a...
Curated OER
Our Favourite Halloween Treat
Students conduct a survey about Halloween candy and create a bar graph illustrating the data. For this data analysis lesson, stud nets are introduced to the topic with a discussion and survey, then the class creates a large graph and...
Curated OER
Exploring Power-Law Functions Using WISE Data!
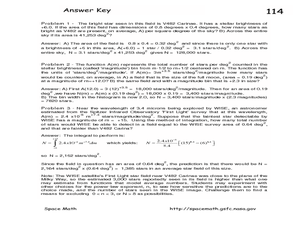
In this power-law functions activity, students solve 3 problems using data from the Wide-field Infrared Survey Experiment in the constellation Carina. Students use a photograph to determine the number of stars as bright as the brightest...
Curated OER
Bar Graphs
Young scholars perform operations and graph their data using charts and bar graphs. In this algebra lesson, students follow specific steps to make a bar graph. They create a survey about people favorite things and plot their data from...
Curated OER
Thinking About Credit
Students examine the use of credit such as installment purchases and credit cards. In this credit lesson, students learn the vocabulary associated with credit usage such as mortgage, credit report/score, and debit cards. They determine...
Curated OER
Line 'Em Up!
Students find coordinate points on a grid and create a line graph with those points. This lesson should ideally be used during a unit on various types of graphs. They make and use coordinate systems to specify locations and to describe...
Curated OER
Graphing
Learners investigate graphing. In this bar graph lesson, students view an informational website about graphing, then construct a class birthday bar graph outside with sidewalk chalk. Learners choose a survey topic, then collect data and...
Curated OER
Eatem Up!
Students identify, interpret and demonstrate a positive learning attitude. They identify, comprehend and use basic concepts and skills and then, communicate clearly in oral, artistic, written, and nonverbal form. Students also identify...
Curated OER
Data Handling
In this data handling worksheet, students determine biased and unbiased questions to surveys. They explore methods of data collection and design a data collection sheet. This two-page worksheet contains 3 multi-step problems.
Curated OER
Randomness and Probability
For this statistics worksheet, 11th graders complete word problems by analyzing data given to them. They answer the probability of an even occurring and reasons it should occur. There are 16 questions on this worksheet.
Curated OER
Union and Intersection of Sets
In this Algebra I/Algebra II worksheet, students determine the intersection and union of sets and solve problems with Venn diagrams. The three page worksheet contains a combination of seventeen multiple choice and free response...
Curated OER
Data Scavenger Hunt
Eighth graders discuss how data is collected and participate in data collection through a survey. They complete a scavenger hunt on the Internet to gain understanding of the data measures mean, median, mode, and range.
Curated OER
The Global Warming Debate and the Arctic Ice Cap
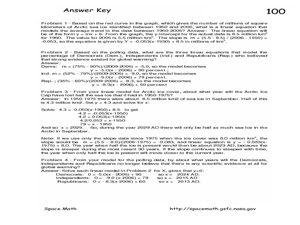
In this global warming and the Arctic ice cap worksheet, students use two graphs showing data about the amount of Arctic sea ice between 1950 and 2006 and the percent of people surveyed that believe the Earth has gotten warmer over the...
Curated OER
Weight Training
Young scholars conduct a class-wide survey collecting, compiling, and analyzing data about fitness, weight loss, and body image issues. They analyze the relationship between exercise and diet in weight control.
Curated OER
Numbers and Me
Students collect and graph data about themselves. In this collecting and graphing data lesson plan, students poll their classmates about how many siblings they have or they measure their height. Students make a bar graph of their data....
Curated OER
Too Free, Or Not Too Free?
Students create a survey that examines what level of electronic surveillance might be acceptable to members of the school and community. They poll the community, and analyze the results in the form of graphs and a written news article.
Curated OER
Arthur Young and the President
High schoolers work with NASS data by converting it into prose. For this historical agriculture information lesson, students read about how George Washington communicated information about crop yields, livestock, and land values. They...
Curated OER
Stars and The Modern Telescope
In this stars and the modern telescope worksheet, students use a photograph taken by the 2MASS telescope to calculate the number of bright stars and faint stars in the picture, the size of the picture, and the number of stars expected to...
Curated OER
Power Functions: A Question of Magnitude
In this power functions worksheet, students read about determining the brightness of stars using a magnitude scale. Students solve 4 problems including finding the magnitude differences of stars and determining equivalent magnitudes.
Curated OER
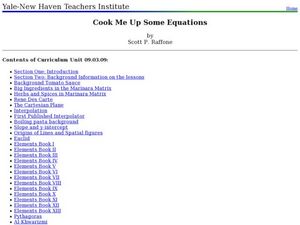
Cook Me Up Some Equations
Learners study a variety of math concepts in the context of cooking up a meal. In this math lesson plan, students calculate surface area and volume. They draw and interpret different types of graphs.
Curated OER
Fit With Fiber
Sixth graders investigate the nutritional value of different types of cereal. They take a survey of students that ate breakfast and create a circle graph with the results. Students examine the nutritional information on the sides of the...
Curated OER
M & M Madness
Students work with the mathematics unit of collection, organization, and presentation of data. In this math and technology lesson plan, students use Valentine M & M’s and The Graph Club to sort and graph the various colored M & M’s.
Curated OER
Ranging the Triple M's
Fifth graders explore collecting and analyzing data. In this mean, median and mode lesson, 5th graders use real word data to determine the mean, median and mode. Students are given sets of numbers on index cards as asked to find the...


