Curated OER
Data From Interviews
Students create and conduct a survey about favorite foods, gather and represent the data, interpret data and make predictions to present to the class. They create and use interview questions to gather data. Pupils are explained that...
Curated OER
Leveled Problem Solving Solving Proportions Using Cross Products
In this solving proportions using cross products practice worksheet, students sharpen their problem solving skills as they solve 6 story problems.
Curated OER
Collect and Organize Data
In this data analysis learning exercise, 4th graders use a tally chart about favorite television programs. They record which are least or most popular, rankings, and combinations of programs.
Curated OER
Collect and Organize Data: Homework
For this collecting and organizing data worksheet, students use the tally chart for the students' eye color to answer the first two questions. Students then survey their family for eye color, record those results in a tally chart, and...
Curated OER
Graphing Data
First graders explore the concept of graphing. In this data lesson, 1st graders gather information from a class survey and display their findings on a picture graph. Students also practice solving problems that their instructor models.
Curated OER
Graphing Data
First graders learn how to display data using a bar graph. In this bar graph lesson, 1st graders use data from a t-shirt color survey to make a bar graph. They also make an animal bar graph before interpreting the information.
Curated OER
Use Fractions to Compare
In this fractions worksheet, students use 3 circle graphs to complete 3 tables, then answer 3 questions, using the graphs to compare information in tables. Answers available on page 2.
EngageNY
End-of-Module Assessment Task: Grade 7 Mathematics Module 5
Show learners how to use simulations and random sampling to reach conclusions with the last resource in a 25-part series. The assessment contains three scenarios, each with several parts, and covers comparing populations using random...
Curated OER
Triangles & Congruence, Proportions & Similarity, Right Triangle & Trigonometry
High schoolers are introduced to the topic of congruence and proportions in Geometry. Using technology, they construct and validate the properties of various geometric figures and identify whether it is congruent or proportion to the...
Curated OER
Data Analysis
Twelfth graders collect and analyze data. In this secondary end-of-course mathematics lesson, 12th graders formulate a question they would like to answer and decide on an appropriate means of data collection. Students present their...
Curated OER
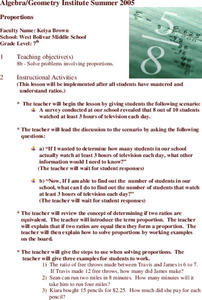
Proportions
Seventh graders participate in a instructional activity that focuses on having them solve different proportions. The instructional activity includes an example that the teacher can work from in order to deliver direct instruction.
Curated OER
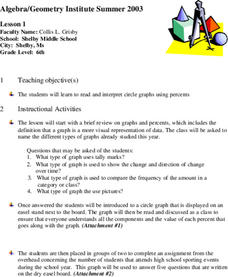
Circle Graphs
Sixth graders participate in a lesson that covers the reading and interpretation of a circle graph. They review the part of a whole concept for percents and student observe and practice using the circle graph.
Curated OER
Worksheet 15
In this math worksheet, students predict the velocity of an object. They also examine the position of the object in relation to the time.
Curated OER
Sampling Bias And the California Recall
Using a 2002 California Gray David recall vote as an example, young statisticians identify sources of bias in samples and find ways of reducing and eliminating sampling bias. They consider ways to select random samples from a...
Curated OER
Show Me The Data!
Pupils create a bar graph. They will collect and organize data to turn into bar graphs. They create graphs for the favorite sports of the class, color of M&M's, and types of cars passing by.
University of California
Seasons Lab Book
Unlock the mystery behind seasonal change with a collection of worksheets and activities. Whether they are drawing pictures of Earth's orbit around the sun or graphing the temperature and daylight hours of different locations from around...
Virginia Department of Education
Linear Modeling
An inquiry-based algebra instructional activity explores real-world applications of linear functions. Scholars investigate four different situations that can be modeled by linear functions, identifying the rate of change, as well as the...
Hood River County School District
Text Structure: Features and Organization
Teach learners how to interact with both fiction and non-fiction text with a packet of activities and worksheets. After looking over text structure and the difference in text features between different types of writing, readers analyze...
Curated OER
A Picture is Worth a Thousand Words
Sixth graders work to write questions for a class survey. In this survey lesson plan, 6th graders survey their class members by asking the 4 questions they developed and will record their answers on the culminating assessment provided by...
Curated OER
Give It Back From a Snack Lesson 2: Invest With the Best
Students survey schoolmate as to what type of snacks they would prefer to purchase. They graph the results and apply them to planning a classroom snack sale while examining what wants, needs, and consumers are.
Curated OER
Which is Your Favorite Dr. Seuss Book?
In this student survey worksheet, students gather information on classmates' favorite Dr. Seuss books. Students use a second worksheet to graph the results of their surveys.
Curated OER
Going with the Flow
Pupils survey each other and determine their common interests. They examine the use of algorithms by various websites that are used to develop networks of interest groups among users. They then design proposals for a social networking...
Curated OER
The Design Revolution: Get the Word Out
Students research the "Design for the Other 90%" exhibition and create a presentation about the low cost designs. In this design lesson, students read and watch a video about the project. Students survey people about publicizing events....
Curated OER
The Gathering and Analysis of Data
Young mathematicians gather data on a topic, graph it in various forms, interpret the information, and write a summary of the data. They present their data and graphs to the class.


