Curated OER
Quick Questions
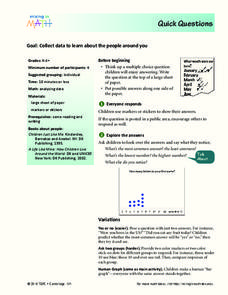
Students ask their classmates survey questions. In this survey lesson, students come up with a question and possible answers. Their classmates mark their answers and the class discusses what they notice.
Curated OER
Our Favorites
Students participate in and conduct a survey to determine various class favorites. They collect, organize and display their data, interpret the results, and complete a packet of worksheets to display the information.
Curated OER
Charting and Graphing Sales
Students analyze and represent weekly sales figures using tables, bar graphs, and pie charts. They draw conclusions using bar graphs and pie charts. Students are told that each day at school they have the option of buying or bringing a...
Curated OER
Level 2 Fraction Sets
In this mathematics worksheet, students solve various word problems by selecting the correct fraction for each response. There are eight problems to solve on the sheet.
Curated OER
My Teeny Tiny Book (Counting to Ten in Different Languages)
In this counting to ten mini book, students cut out and color a book that shows the numbers from 1-10 and the words for the numbers. The languages in this book are: English, Spanish, French, Swedish, Japanese and Swahili. Pronunciation...
Curated OER
A Measure of Happiness
Students share opinions about the factors that contribute to or detract from their happiness. They create survey to determine how people in their community measure happiness, and write reflections on the relationship between money and...
Curated OER
Picture Graphs
First graders work with picture graphs, create their own individual graphs, and construct and read graphs.
Curated OER
Interpreting a Pictogram
For this pictogram worksheet, students interpret a pictograph on ladybirds and answer 5 short answer questions or drawings referring back to the pictogram. Students carry out their own scenario pictogram and draw a table with their results.
Curated OER
6 Poisson Distributions
Students explore the concept of poison distributions. For this poison distribution lesson, students construct poison distributions by surveying the number of cars that pass a point in a specific amount of time. Students find poison...
Curated OER
Thinking About Credit
Students explore the concept of credit. In this credit lesson, students discuss what it means to buy items using credit. Students discuss how interest accrues and how much is really being paid with a credit card. Students calculate...
Curated OER
Class Time Capsule
Students record and graph information about themselves and the class. They put the information in a time capsule that they reopen at the end of the year.
Curated OER
Graphing Favorite Holidays
Students create spreadsheets and bar graphs based on results of survey of favorite holidays.
Curated OER
SkittleGraphs
Second graders discover how to make a bar graph. Each student receives a bag of Skittles candy. They make a bar graph which documents the colors found in the bag. At the end of the lesson, the Skittles are eaten. Fun!
Curated OER
Health/Wellness Interdisciplinary Unit
Learners examine human body systems, research a disease or condition, analyze their family trees to look for health conditions and/or diseases which may be prevalent, discover ratio and proportions of human body, and read novel, The...
Curated OER
Mr. Cobbler's Shoe Dilemma
Students employ statistics to solve real-world problems. They collect, organize and describe data. They make inferences based on data analysis. They construct, read, and interpret tables, charts and graphs.
Curated OER
Problem Solvers for Life
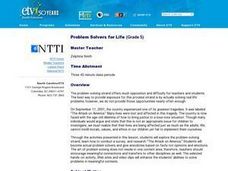
Fifth graders identify and explore the components of solving a problem. Students conduct a survey to collect, analyze and interpret data based on a given problem. Also, 5th graders use a variety of strategies to solve math problems,...
Curated OER
Help the Frogs
In this frogs and numbers worksheet, students match the five numbered frogs to the same number of bugs by drawing a line from one to the other.
Curated OER
Matrices
In this Algebra II instructional activity, 11th graders solve problems that involve matrix representation, matrix operations, solving systems with inverse matrices, row reduction, and systems of inequalities. The six page instructional...
Curated OER
Statistical Pictures of School and Life
Students explore how mathematical data is used to summarize and illustrate everyday life. They apply mathematical concepts and skills to analyze data. Students conduct a five question survey of 50 people or more and graph the data.
Curated OER
Use Proprotions To Solve Word Problems
Eighth graders explore ratios and proportions and how they are used in day to day life. As an activity, they find their own heart rate and then take a survey of other heart rates in the room. After organizing the data, 8th graders use...
Curated OER
Makiing Sense of the Census
Students investigate trends in agriculture. In this secondary mathematics lesson, students evaluate agricultural census data from 1982 to 2202 as they compare the properties of the mean and the median. Students explore what sorts of...
Curated OER
Taking Poll Information
Students investigate the election and poll surveys. In this statistics lesson, students take poll information and analyze the data. They graph their data and make predictions and conjectures.
Curated OER
Sampling: An Exercise in Statistics Introduction
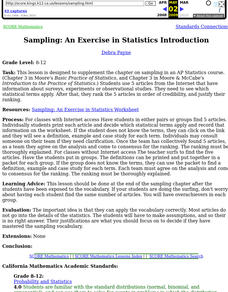
Students use 5 articles from the Internet that have information about surveys, experiments or observational studies. They need to see which statistical terms apply. After that, they rank the 5 articles in order of credibility, and...
Curated OER
Statistics: Reading and interpreting production graphs
Students interpret and create different types of graphs. They analyze data from charts, develop a survey and design appropriate graphic illustrations and make a presentation.


