Curated OER
Your Just Desserts
Students write letters to town officials and local businesses asking for favorite dessert recipes. They tabulate their responses in a spreadsheet. Students turn their survey results into colorful graphs.
Curated OER
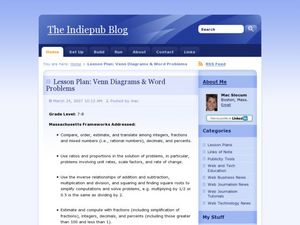
Venn Diagrams & Word Problems
Students explore the concept of Venn Diagrams through word problems. In this Venn Diagram lesson, students solve word problems about groups of people using Venn Diagrams. Students use survey results about MySpace and Facebook in a Venn...
Curated OER
Do You Have a Coin Collection?
Learners create a graph showing which students in the class collect coins.
Curated OER
Do You Like to Spend or Save?
Students, after briefly discussing spending and saving habits, take a poll to see how their peers like to manage money. Then students graph their findings and discuss the survey results.
Curated OER
Turkeys or Eagles?
Students discuss how Benjamin Franklin wanted the wild turkey (not the bald eagle) to be our national bird and then graph their preferences and discuss the survey results.
Curated OER
Opening the Case
Students participate in a class survey and then design an experiment and use graphs and statistics to assist them in solving a problem. They organize the results of the survey in a stem-and-leaf plot and find the range, median, mean, and...
Curated OER
Getting to Work
Young scholars examine the modes of transportation people use to get to work in Canada. They examine how the methods chosen differ among provinces and among urban areas. They focus on the choices people make when selecting a method of...
Curated OER
Food for Thought
Third graders conduct a survey of their class' favorite foods voting on 3-4 favorites overall. They then go to the computer lab and examine how to produce a horizontal bar graph by graphing the favorite foods of the class.
Curated OER
Which is Your Favorite Beatrix Potter Book?
In this survey activity, students use the form to gather information on people's favorite Beatrix Potter books. Students graph the results. Prior knowledge of multiple Beatrix Potter books is assumed.
Curated OER
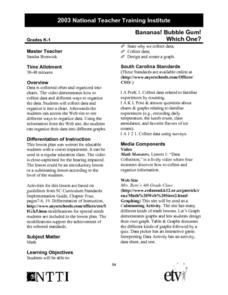
Bananas! Bubble Gum! Which One?
Students design and create a graph of data they have collected on their favorite candy bars. They explore how to organize data as well.
Curated OER
Managing Your Money
Students discuss different money management options in a variety of situations. They identify moments to share, spend and save money.
Curated OER
Food Ways - Graphing
Sixth graders choose the appropriate graph to display collected data. They interview each other on what foods they eat. They also interview elders and find out what types of food they grew up eating. They create graphs to display the...
Curated OER
Parting Ways
Students become part of the solution as they practice figuring percents. The number of men versus women present in the room and their heights can be used to form the basis of this investigation.
Curated OER
Data Collection Project
Students collect data using email. They calculate the mean, median, mode, range and outliers. They create a graph using the data results. They write five paragraphs to summarize their data.
Curated OER
It's Your Choice
Students compare data and determine the appropriate way to organize the data. They use physical graphs, pictographs, and symbolic graphs to display their data. In addition, they complete a Venn diagram.
Curated OER
Daily Subtraction
In this math worksheet, students find the answers that are given daily. They work on the mental math of performing subtraction.
Curated OER
Mother May I?
Third graders measure distance using nonstandard units of measure. In this measurement lesson, 3rd graders measure a given distance through the use of the game "Mother May I?" Student gather and compare data on how many "giant steps" and...
Curated OER
School Food Waste
Learners see how much food is thrown away at their school each day. They utilize a survey form imbedded in this plan to organize their research. They use the information gathered to make some suggestions about how to decrease food waste...
Curated OER
Follow The Falling Meteorite
Middle schoolers investigate the supposed traveling path of a meteorite. They use sound in order to triangulate the path. The results of the experiment are written on a map to display the path of the meteorite. The culminating activity...
Curated OER
Percentages Level 2
In this math learning exercise, students solve the word problems in order to solve the problems using percentages. They apply the percent proportion.
Curated OER
Scavenger Hunt
Young scholars collect data about lighting conditions around a room using a light sensor and RCX. They use software to upload and analyze the data in order to draw conclusions about light intensity in the room.
Curated OER
The Bigger they Are . . .
Pupils do a variety of data analyses of real-life basketball statistics from the NBA. They chart and graph rebounding, scoring, shot blocking and steals data which are gathered from the newspaper sports section.
Curated OER
Shopping for Toys
Young scholars pretend as if they have just won a $100 gift certificate to buy some toys and must try to spend as much of it as they can without going over.
Curated OER
Distribution of children living at home
Students examine census data to evaluate the number of students of certain ages living at home. This data is then used to determine the need for day care, or other social programs. They use this information to explore social policies.


