EngageNY
Two Graphing Stories
Can you graph your story? Keep your classes interested by challenging them to graph a scenario and interpret the meaning of an intersection. Be sure they paty attention to the detail of a graph, including intercepts, slope,...
EngageNY
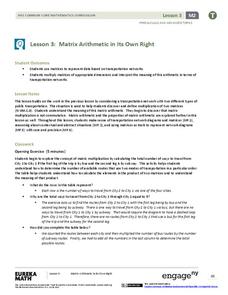
Matrix Arithmetic in Its Own Right
Matrix multiplication can seem random to pupils. Here's a instructional activity that uses a real-life example situation to reinforce the purpose of matrix multiplication. Learners discover how to multiply matrices and relate the process...
Curated OER
What's the Frequency, Roy G. Biv?
Introduce starting space scientists to the electromagnetic spectrum, expecially the portion of visible light. Teach them about wavelength and frequesncy. Then give them a roll of adding machine tape and a manila folder to make a...
Curated OER
Money: Bucks, Banks, and Business
Put economics and currency exchange rates into a real-world application kids can understand. They'll compare bus fares from various cities around the world. Each child selects three international cities to research. They determine the...
Curated OER
Matrix Analysis of Networks
Explore the connection between a finite graph, a directed graph, and a matrix. Graph lines and identify the relationship of matrices in real-world scenarios. Then use this information to work with a partner to plan and design a town...
Curated OER
Bird and Dog Race
Your pupil's pet dog and bird are racing down the city streets. In order to know who is going to win, they better know something about calculating rates, the Pythagorean Theorem, and applying those topics to the map of the city.
Illustrative Mathematics
Walk-a-thon 2
During a walk-a-thon your learners must determine the walking rate of Julianna's progress. Using tables, graphs, and an equation, they must be able to calculate the time it took her to walk one mile and predict her distance based on the...
West Contra Costa Unified School District
Introduction to Trigonometric Functions
Scholars first learn the definitions of the sine ratio, the cosine ratio, and the tangent ratio. After mastering these definitions, they use the new information to solve triangles.
Mathed Up!
Scatter Graphs
Make an estimate by getting in line. The class works with scatter plots and lines of best fit to make an estimate for given values. Pupils determine whether there is a positive or negative correlation and draw a best-fit line. Using the...
Curated OER
No More Traffic Jams: Lesson 3
Traffic is a very real concern for any Urban dweller. After watching a video showing various traffic issues and solutions, learners group up to discuss and develop innovative traffic solutions of their own. They explore vocabulary and...
Houston Area Calculus Teachers
Collecting Driving Data
Give AP Calculus classes the opportunity to check the accuracy of their calculations! A calculus activity involves the collection of data, the application of mathematics, and the analysis of the accuracy of results. Young mathematicians...
EngageNY
Modeling with Inverse Trigonometric Functions 1
Where should I stand to get the best view? Pupils use inverse trigonometric functions to determine the horizontal distance from an object to get the best view. They round out the lesson by interpreting their answers within context.
Mathed Up!
Two Way Tables
When presented with categorical data, a two-way frequency table is a great way to summarize the information. Pupils organize categorical data using a two-way table, then use the tables to determine missing data and to calculate simple...
California Education Partners
Science Fair Project
Plant the data firmly on the graph. Given information about the growth rate of plants, pupils determine the heights at specific times and graph the data. Using the information, scholars determine whether a statement is true and support...
Curated OER
Word Problems Dealing with Ratio and Proportion
Mindful middle-schoolers read and solve a number of word problems. Learners copy and discuss what they believe their strategies are in solving each problem. They also write their findings and share with the rest of the class.
West Contra Costa Unified School District
Motion Problems
Let's hope class participants don't get motion sickness. In the lesson, class members first solve motion problems using tables and graphs. They then use algebraic techniques to solve motion problems.


