Mathematics Vision Project
Module 9: Statistics
All disciplines use data! A seven-lesson unit teaches learners the basics of analyzing all types of data. The unit begins with a study of the shape of data displays and the analysis of a normal distribution. Later lessons discuss the...
US Department of Commerce
Commuting to Work: Box Plots, Central Tendency, Outliers
Biking may be an outlier. Using data from 10 states on the number of people reporting they bike to work, pupils calculate the measures of center. Scholars determine the range and interquartile range and find which provides a better...
US Department of Commerce
Does the Percentage of People Who Walk to Work in Cities Vary with Population Size?
To walk or not to walk? Pupils create box plots comparing the percentage of residents who walk to work in large, medium, and small cities. Using the box plots, class members compare the data that reflects available statistics. Scholars...
US Department of Commerce
The Census Questionnaire: Then and Now
As the United States has changed, so has the census! While required by the Constitution, the questions the government asks to allot representation and federal funding has developed over time. Using images of previous censuses, young...
Curated OER
Populations Lab - Cultures Lesson: Statistics / Sampling Patterns
Ninth graders examine the application of statistical sampling, data collection, analysis, and representation that exists in schooling and teenage lifestyles in Japan and the United States.
Curated OER
Sampling Bias And the California Recall
Using a 2002 California Gray David recall vote as an example, young statisticians identify sources of bias in samples and find ways of reducing and eliminating sampling bias. They consider ways to select random samples from a...
Curated OER
Linguistic Diversity Secondary
Don't be scared off by the title! Read this information packet with your class, or send them off on their own. After each section, you'll find a series of comprehension questions. Great preparation for state testing!
Curated OER
Show Me The Data!
Pupils create a bar graph. They will collect and organize data to turn into bar graphs. They create graphs for the favorite sports of the class, color of M&M's, and types of cars passing by.
Curated OER
Keep, Grow, Change Exit Tickets
Before your youngsters head out the door, capitalize on the special opportunity to have them immediately reflect on their learning experience and to assess what knowledge they are taking away from the class period.
Worksheet Place
Back to School
Get an idea of how your learners are feeling now that they are back in school with a quick activity. Kids complete 12 sentence starters in order to express their thoughts on the new year. Why is it fun? Why is it stressful? The final...
Curated OER
Applying SQ3R to Texts
After a review of the SQ3R strategy, readers use the provided prompts to respond to a text. The value of this worksheet is in the additional questions that move the learner into higher levels of reasoning.
Curated OER
Measuring Crime and Fear of Crime
Have your learners delve into the realm of crime statistics using this resource. They use data to answer a series of questions about crime in Britain.
Curated OER
Social Change
Students study a social issue involving gorillas, and work in groups to develop strategies to increase awareness of and problem solve a solution for the issue. They collect data using handheld computers and write a report.
Curated OER
Favorite Food
Students are given three choices of food. They then decide on their favorite and predict what the class's favorite food will be. After the teacher enters the data into the computer, students gather around the computer to view the...
Curated OER
Graphs to Represent a Data Set
Here are a some pre-made sets of data that kids can use to practice data analysis. There are 10 survey scenarios written out, and scholars synthesize the results of each into a bar graph. In addition to the graphing, they answer two...
Curated OER
Where is Everybody?
Middle schoolers collect data from different grade levels at their school and develop thematic maps which show population density, and determine how this might affect the school and themselves in the future.
Curated OER
Popcorn Math
Everyone loves popcorn! Use this treat to teach math concepts including place value, estimating, graphing, and volume. Eight possible activities are included, and they can be modified to fit all grade levels.
Curated OER
Fun Along the Way: Technology and the Teaching of World Languages
Students record themselves saying basic biographical facts about themselves: : what their names are, where they live, how old they are, what languages they speak, and what activities they like to do. They practice their presentational...
abcteach
What is Your Favorite Month?
A simple worksheet that helps learners conduct a survey is here for you. In it, pupils collect data on their family and classmate's favorite months. Youngsters use tally marks in the spaces provided to keep track of the answers. Once...
Curated OER
Language Learning Course Case Study
English language learners prepare to be a part of the workforce with this resource. Included is a brief survey, the results of that survey, and some intra-office memos. There are several vocabulary terms worth covering like:...
Curated OER
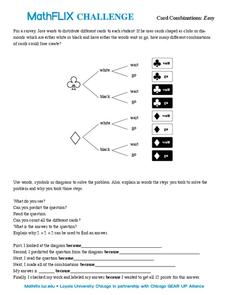
Card Combinations
For this card combinations worksheet, students solve and complete 8 different problems that include determining the number of card combinations found. First, they use words, symbols or diagrams to solve the problem and explain the steps...
Curated OER
Harry Potter: Study Questions
Elementary learners explore fiction storytelling through partcipating in a survey. They identify the characters, themes and plot of the Harry Potter series while discussing their opinions in class. Learners conduct a survey about their...
Curated OER
Data Analysis: For Little Learners
Using pictographs, tally charts, and surveys, kids learn all about data analysis and collection. They make surveys, collect data, then construct pictographs and tally charts to organize their information.
Curated OER
Graphs that Represent Data Sets
Use these pre-made data sets to introduce kids to bar graphs and data analysis, and then have them take surveys on their own. There are 10 survey scenarios written out here, and scholars synthesize the results of each into a bar graph....
Other popular searches
- Conducting a Survey
- Favorite Things Survey
- Land Survey
- Student Survey
- Reading Interests Survey
- Drug Abuse Survey
- Elementary Math Survey
- Health and Fitness Surveys
- Leisure Survey
- Esl Survey
- Interest Survey
- Elementary Math Survey\


