Curated OER
Slanted Surveys And Statistics
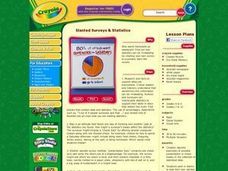
Students engage in a lesson plan that is concerned with the use of statistics and surveys and how they should be read. They create a survey and take it home to collect data. Then students display the data on a graph that is displayed in...
Curated OER
Survey Says...
Young statisticians collect, organize, and present data to illustrate responses to a survey question. They write and conduct the survey. They finish by presenting the results in the form of a graph.
Howard Hughes Medical Institute
Survey Methods
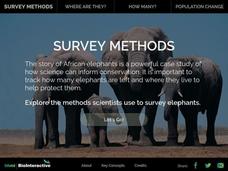
How many African elephants are on earth? How do scientists answer a question like that? An interactive resource explains a variety of survey methods and their advantages and disadvantages. It connects the need for a survey to...
US Department of Commerce
Creating and Taking a Survey
Individuals learn how to conduct surveys and collect data for the class on age, pets, and number of people at home. Scholars compare their household size to the information in the census. Pupils then develop additional questions to ask...
Radford University
Survey Activity
It's time to take a survey. After looking at an example of a survey on lunch preferences, groups design their own surveys. They consider the sample size and sampling technique, then conduct the surveys. As a final activity, they create...
Radford University
The Science of Surveys
To drill or not to drill? An informative unit has scholars first research the advantages and disadvantages of oil drilling in Alaska. They set up and conduct a sample survey to assess attitudes toward oil drilling in a specific...
Radford University
Super Survey!
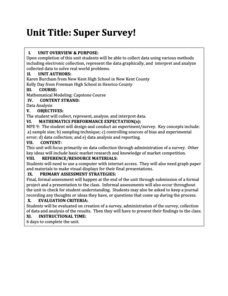
Here's a super survey on supermarket products. An interactive lesson has classmates design and conduct surveys on a product of interest. They analyze the data, choose a data display method, and present their findings to the class.
Radford University
Peer Survey on Current Events
Stay up to date on current events as well as how the class views the issues. A performance task has scholars select a current event of interest and design a class survey on the topic. They conduct the survey, analyze, and report the...
Radford University
Analyzing Data from Peer Survey
We all want to know what we're thinking. Scholars analyze and report data collected in a previous survey on peer attitudes toward current events. They calculate the mean, median, range, and standard deviation before creating histograms...
Radford University
PHamily PHeud: An Exploration in Surveys
Get to know the class much better. Scholars brainstorm a topic of interest and then design and conduct a class survey. Using the top responses, they create a game similar to Family Feud and take part in a class competition.
Curated OER
Survey Says...
Young learners create and implement a school-wide survey about student body favorites! Learners record and analyze the data on a bar graph, picture graph, and line graph, and then display the data. Then, wrap it all up with a celebration...
Curated OER
Favorite Vegetable Survey
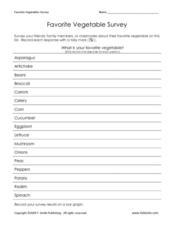
What's your favorite? Use this chart template in your lesson on data collection and graphing. Learners record classmates' favorite vegetable in a survey, and then graph the results. A labelled graph is provided here- print both pages...
Curated OER
And the Survey Says...
Create a survey and graph! In this graphing lesson, learners listen to a story about pets, create a survey for family and friends about what pets they own, and use the information to create a bar and line graph.
Curated OER
Surveys and Graphing
First graders survey different classrooms to determine types of products students would like to see sold at school, and create graphs based on survey results.
Google
Surveys and Estimating Large Quantities
Looking for an estimation activity a bit more involved than the typical "guess the number of jellybeans in the jar" game? Here, learners use a picture to estimate the number of people at a large event, look for potential problems with...
Curated OER
Survey of Height
For this data collection worksheet, learners survey the heights of their fellow classmates, organize their data in a data table, and create a bar graph from their data. Once bar graph is completed, students complete 2 short answer...
Alabama Learning Exchange
Ice Cream Sundae Survey
Young scholars analyze data through graphs. They will complete a class survey on ice cream sundaes and tally and graph the responses. They then analyze the information from the class graph.
Curated OER
Boy Scout Merit Badge: Surveying
In this boy scout merit badge: surveying worksheet, 8th graders research the websites listed to answer 8 detailed questions about first aid, surveying projects, GPS, the impact of surveying and careers.
Curated OER
TV Survey - Data Collection and Analysis
In this data collection and analysis worksheet, 4th graders complete a tally chart about the number of hours that fourth graders watch television. They create a bar graph with the information, write a paragraph about the survey results,...
Curated OER
Asthma Survey
Learners collect survey data on the prevalence of asthma in a community. They summarize and display the survey data in ways that show meaning.
Curated OER
Fast Food Survey Using Bar Graphs
Second graders create a bar graph to pictorically represent the data collected from a survey of students. They use Excel to electronically create the graphs and data tallies. They then interpret their data using sentences to explain.
Curated OER
Fire Safety Survey
Students collect data regarding fire safety and create a graph. Working in small groups, they administer a survey to family and friends regarding their attitudes toward fire safety. After data has been gathered, students graph their...
Curated OER
School Safety Survey Project
Students investigate safety issues at school. In this citizenship lesson, students discuss things they are fearful of at school. Students then conduct a school survey asking what others are fearful of.
Curated OER
Surveying
Learners calculate angles and areas for a surveying project. They gather information and diagram a project. They identify and define surveying principles and terminology.
Other popular searches
- Conducting a Survey
- Favorite Things Survey
- Land Survey
- Student Survey
- Reading Interests Survey
- Drug Abuse Survey
- Elementary Math Survey
- Health and Fitness Surveys
- Leisure Survey
- Esl Survey
- Interest Survey
- Elementary Math Survey\


