Curated OER
Candy is Dandy
Students investigate color distribution in bags of M&Ms They sort and classify the contents of a bag of M&Ms and summarize their findings on a worksheet. Students convert the numbers into charts and make predictions about color...
Curated OER
How Much Will I Spend On Gas?
Students construct a linear graph. In this graphing lesson, students determine a monthly budget for gasoline. Students construct a t-chart and coordinate graph to display data. Resources are provided.
Curated OER
Inference Lesson Plan
Students practice assessing graphics to infer and identify an author's implicit and explicit meaning in a piece of text. They evaluate the effectiveness of information found in maps, charts, tables, graphs, diagrams, cutaways and through...
Curated OER
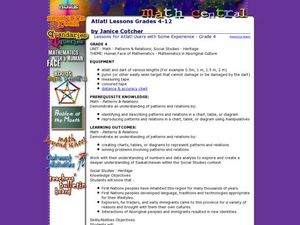
Atlatl Lessons for Grade 4
Fourth graders explore the weapons of the Aboriginal people. In this fourth grade math lesson, 4th graders create charts, tables, or diagrams to represent patterns and relations. Students investigate which dart length has the best...
Curated OER
Evaluating Data
In this data worksheet, students learn how to organize the data collected during an experiment and practice finding patterns. Students graph a table of experimental data and complete 1 short answer question.
Curated OER
Doing The School Run
Pupils explore finding the percent of a numbers. They survey their peers to determine modes of transportation used in getting to school. Afterward, students organize information and create graphs and charts. They explore alternative...
Curated OER
M&M Caper
Students participate in a game with M&M's to be introduced to percents and ratios. Individually, they estimate and record the number of candies they believe the bag holds and the amount of each colored candy. They open the bag and...
Curated OER
Energy Costs of Walking and Running
In this energy worksheet, students use a data chart comparing the energy used while running and walking to create a graph and complete 2 short answer questions.
Curated OER
How Many Toothpicks?
Students investigate different geometric patterns. In this geometry lesson, students create different shapes using toothpicks. They create different patterns and designs and complete a charts using different measurements.
Curated OER
Fast Food: You Can Choose!
Learners research the nutritional value of fast food. They assess which fast foods are best and worst to eat. They organize their data into tables and graphs and explain their findings to other students.
Curated OER
Data Collection and Presentation
Students concentrate on discrete quantiative data. They are shown that the vertical line diagram as a more appropriate way to present discrete quantiative data then bar charts. Students work as a group to help with the interpretation...
Curated OER
Let's Flip a Coin
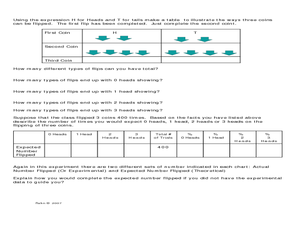
In this probability instructional activity, learners use a TI graphing calculator to simulate flipping a coin and compare their results (experimental probability) to the expected results (theoretical probability). The five page...
Curated OER
Using "Why Mosquitoes Buzz in People's Ears" to Teach Cause and Effect
Students discuss cause and effect relationships and the chain reaction involved before listening to the story "Why Mosquitoes Buzz in People's Ears". Students create flow charts to show the chain reactions of causes and effects in the...
Curated OER
Mathematical Magazines
Young scholars classify and tabulate the type of advertisements found in a collection of magazines. Determination is made on what percent of the total number of ads each type represents. They present their results orally and in a graph.
Curated OER
The Survey Says
Young scholars experience the development of statistical data. In groups, they construct a survey questionnaire for a target audience. Students produce the questionnaire, distribute it, collect it, and tabulate the data. Using EXCEL,...
Curated OER
Jumping in the Air - What was your Height?
Students solve equations using the quadratic formula. In this quadratic equations lesson, students use digital cameras to film students jumping and import film clips into a computer. Students use the data in the quadratic formula...
Curated OER
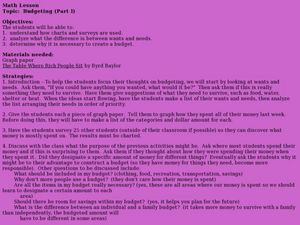
Budgeting (Part 1)
Students examine why a budget may be helpful. In this budgeting lesson plan, students graph how they spent money during the past week. They discuss the benefits of creating a budget and explore the difference between wants and needs.
Curated OER
Linking Real World Data to the Classroom
Students analyze data representing real life scenarios.In this algebra lesson, students collect, plot and analyze data using a graph. They use different methods to represent and present their data.
Curated OER
Supermarket Smarts
Pupils examine how a consumer can make informed choices. They visit stores with a prepared shopping list, record the prices on a spreadsheet, create graphs, and create a Powerpoint presentation comparing the total cost of stores and a...
Curated OER
Using Radiosonde Data From a Weather Balloon Launch
Student use radiosonde data from a weather balloon launch to distinguish the characteristics of the lower atmosphere. They learn the layers of the atmosphere. They graph real atmospheric data.
Curated OER
Cold Enough?
Students read and record temperatures and display the data. They represent the temperatures on an appropriate graph and explain completely what was done and why it was done. Students display the data showing differences in the daily...
Curated OER
Trouble in the Troposphere
Students Use data sets from MY NASA DATA to produce graphs comparing monthly and yearly ozone averages of several U.S. cities. They analyze and evaluate the data and predict trends based on the data. In addition, they discuss and...
Curated OER
Analyzing Health
Third graders analyze their health. In this analysis lesson plan, 3rd graders rate their health on a 1-10 scale. They then tally the scores from the class and create a data chart. Then they answer true and false questions based on...
Curated OER
Linear Functions
Students solve and graph linear equations. In this algebra instructional activity, students collect data and plot it to create a linear function. They identify the domain and range of each line.
Other popular searches
- Charts Graphs and Tables
- Tables, Graphs, Charts
- Graphs Charts Tables
- Maps, Charts, Graphs, Tables
- Charts, Tables, Graphs
- Charts, Graphs and Tables


