Curated OER
Temperature Probe
Fourth graders perform activities that involve electronic measurements through probe software. Students collect data and create a variety of visual formats: graphs, charts, tables, and gauges. They compare and contrast their data to...
Curated OER
Introduction to Scatter Plots and Correlation
Students examine the concept of scatter plots. They compare baseball statistics to locate the ones that correlate with winning, and identify the positive, negative, and no correlation in sets of data using MS Excel.
Curated OER
Michigan Virtual Field Trip
Students analyze data from a virtual field trip to Michigan. They conduct Internet research on mileage and travel time between cities, calculate and compare fuel costs, and research and calculate lodging, activities, and meal costs.
EduGAINs
Data Management
Using a carousel activity, class members gain an understanding of the idea of inferences by using pictures then connecting them to mathematics. Groups discuss their individual problems prior to sharing them with the entire class. The...
Pennsylvania Department of Education
Volume and Surface Area
Build boxes using unit cubes to compare surface area and volume. The group performs multiple experiments to determine properties of volume, such as if it makes a difference which order the dimensions are multiplied in. Extensive...
Curated OER
Conservation of Energy
Fifth graders examine their use of energy over a certain time period. They come up with a plan to reduce their energy consumption and carbon footprint. Groups of learners complete a chart with three columns; energy-using events, the form...
Curated OER
My Car Has Potential
Seventh graders investigate how changes in the mass or height of a ramp can affect the change in potential energy. They discuss the concepts of work and energy, then using the four question strategy, they design an experiment that...
Curated OER
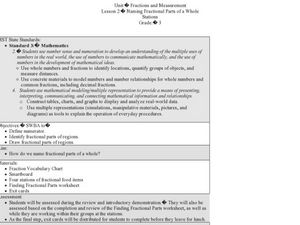
Naming Fractional Parts of a Whole
Third graders complete a worksheet. In this fractions lesson, 3rd graders review fraction vocabulary, use the SmartBoard to divide fractions and complete stations where they work with fractional parts of a whole.
Curated OER
Discovering Pi
Define terminology related to a circle. Practice accuracy in measuring and then create a spreadsheet based on data collected from solving for parts of a circle. Groups can have fun analyzing their data as it relates to Pi.
Curated OER
One Size Fits All?
Students describe the differences between an estimate and a guess. They create reasonable estimates based on comparison and activities. Students explain how estimation is helpful in showing the relative size on a scale. They also...
Curated OER
What's the Fizz Factor
Students as a class create a fountain using both coke soda, and mentos candy. In this science activity, students test which combination of coke and mentos products produce the tallest fountain. Students use the scientific method to track...
Curated OER
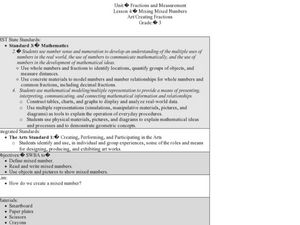
Mixing Mixed Numbers Art/Creating Fractions
Third graders explore number values by participating in class math activities. In this fractions lesson, 3rd graders collaborate with classmates to discuss the technique of adding mix numbers while utilizing paper plates to help...
Curated OER
Sound Busters
Fourth graders engage in a study of sound pollution at their school. After a class discussion on what noise pollution is, learners are asked if they think there are areas of their school or community where noise pollution is a problem....
Shmoop
ELA.CCSS.ELA-Literacy.SL.9-10.2
What are diverse media formats? Have your class figure this out on their own through small-group brainstorming. The resource includes two related activities about different kinds of data that will help your class get a grasp of media...
Curated OER
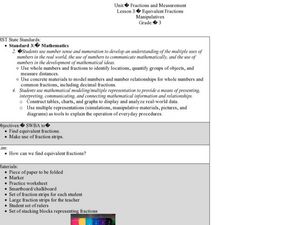
Equivalent Fractions Manipulatives
Students study fractions. In this equivalent fractions lesson, students utilize fraction strips to enhance their understanding of equivalent fractions. They watch a demonstration and then work independently with their own set of fraction...
Curated OER
BEETLES: The Coming Out
Young scholars design an experiment to test the variables involved in the hatching of the Bruchid beetle.
Curated OER
How Do I Get There? Planning a Safe Route to School
One much-needed skill for young learners is direction giving. Have your class plan and draw a safe route for them to travel from home to school. They will also draw places and items that are in between home and school in order to build a...
Curated OER
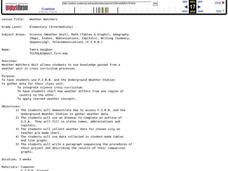
Weather Watchers
Students are introduced to an Underground Weather Stations. In groups, they use the internet to research the weather in different parts of the United States locating each city. To end the lesson, they summarize the information they...
Curated OER
Building Sets of 13 and 14
Compose and decompose sets of 13 and 14 and compare sets of each with your little learners. They use objects to construct sets of 13 and 14, record their answers, and compare sets in several different ways.
Curated OER
Schoolyard Bird Project
Students observe and count bird sightings around their schoolyard throughout the school year.
Curated OER
Glided Age
Eleventh graders will participate to brainstorm on the overhead, characteristics of an "irresponsible" adult and 5 of a "responsible" one? How do these differ if we apply these to businesses? Working in partners--Create a Code of Ethics...
Curated OER
Temperature and Pressure on Airplane Surfaces
Young scholars use the Internet to delve into the relationship between fores and motion on a sizable object. They predict where they think the temperature and pressure be the greatest, and where the pressure be the lowest.
Curated OER
Investigating Scale Factors with the Geometer's Sketchpad
Pupils use Geometer's Sketchpad to examine the scale factor when in is applied to the length of a figure's sides. They look at how the scale factor affects the side lengths, perimeter, and area of the figure that result. They work with...
Curated OER
Housing Arrangements of the Elderly in Canada
Students examine housing for the elderly in Canada. In this sociology lesson, students analyze Canadian Census data to find out what type of housing seniors of the country live in.
Other popular searches
- Charts Graphs and Tables
- Tables, Graphs, Charts
- Graphs Charts Tables
- Maps, Charts, Graphs, Tables
- Charts, Tables, Graphs
- Charts, Graphs and Tables


