Curated OER
Data Analysis, Probability, and Statistics: Exploring Websites
Students measure their pulse rates and place the number on the board. They arrange the numbers in order and discuss the differences between isolated facts and data. Students explore websites that relate to data analysis and report their...
Curated OER
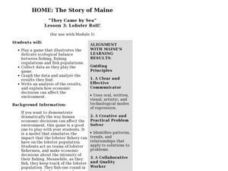
Lesson 3: Lobster Roll!
Students play a game that illustrates the delicate ecological balance between fishing, fishing regulations and fish populations. They collect data and analyze the results.
Curated OER
Scavenger Hunt
Students search for items in various parts of the newspaper noting the different types of information it provides.
Curated OER
On the Surface
Students draw and label the 15 major rivers in Texas. They then draw and label another map with the major lakes and reservioirs of Texas. Students use the maps and locate and label the location of the following major Texas cities:...
Curated OER
The Research Paper - Searching for a Subject
Students research a website to look for potential topics for a research paper. They develop a narrowed prioritized subject list on an index card (3X5) using word processing program.
Curated OER
Traveling Bowls
Students investigate the relationship between force and motion while conducting an experiment to answer the question,"How do objects move?". In small groups, they predict how many washers are needed to pull a bowl across a finish line.
Curated OER
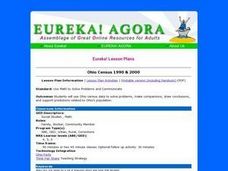
Ohio Census 1990 & 2000
Students use Ohio census data to solve problems, make comparisons, draw conclusions, and support predictions related to Ohio's population. They interpret and work with pictures, numbers and symbolic information.
Curated OER
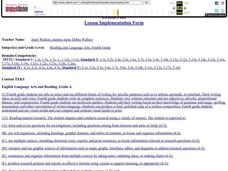
Owning a Pet
Fourth graders identify and use different forms of writing for various purposes. Using the internet, they read and gather information and write quesitons for their own investigations on the various pets they could own. They practice...
Curated OER
Penguin Heights
Young scholars use the worksheet from the first website listed below to collect data on the penguin heights on the Penguin Page.
Curated OER
Pumped Up Gas Prices
Students spend one month keeping track of the mileage and gasoline amounts they or their family has used. Information is entered into a spreadsheet to help calculate the average gas prices over time.
Curated OER
Virginia In the World: The Geography of Commerce
Young scholars examine how Virginia connects with the world through export trade. Using a map, they use symbols to depict the value of trade and the direction of the flow of goods. They complete a scavenger hunt using electronic almanacs...
Curated OER
Aeronautics Propulsion
Students use the World Wide Web to access additional information needed to complete the activities on the forces on an airplane, the function of the stabilizer, and the calculation of Mach speed, temperature, pressure, and thrust.
Curated OER
Buying My First Car
Students pretend they are about to buy their first new car. They must do all the calculations necessary to estimate the cost of purchasing the car. They see that the math they learn in school really does have real-life applications.
Curated OER
Closer To the Ground Lesson 2: Providing a Helping Hand
Students examine how businesses and corporations contribute or sponsor activities for the common good. They read annual reports of major corporations to determine how they contribute to focused activities for the common good.
Curated OER
Where's the Barbecue?
Students identify the major landforms, regions and rivers on a map of South Carolina. They compare the locations of the major Native American groups in the state as well. They chart where barbecue restaurants are located and write...
Curated OER
Temperature Changes in the Atmosphere
Students analyze how different variables affect atmospheric temperature. They construct a model of an ecosystem, select a variable, design and conduct an experiment, and record and analyze the data to present to the class.
Curated OER
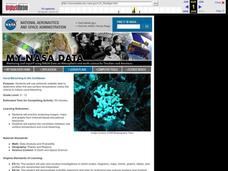
Coral Bleaching in the Caribbean
Students use authentic satellite data on the NASA website to determine when the sea surface temperature meets the criteria to induce coral bleaching.
Curated OER
Michigan Fun Facts
Fourth graders work with a partner to plan, rese,a rch design and publish a
slide show that depicts the most important or interesting facts they
have learned about Michigan. They are given the choice of working in
one of the seven...
Curated OER
Drip, Drip, Drip
Students gather scientific data and be able to utilize the data to generalize results over a long period of time. They use the appropriate tools to measure quanities of liquids and analyze the data to determine the cost of a leaky faucet.
Curated OER
Civil War Letter Web
Students use the internet to gather information on a specific Civil War battle of interest to them. Using the information they gather, they organize it into a web to be used later when writing a letter. They use the web to write their...
Curated OER
Perimeters, Patterns, and Conjectures
Students discover patterns and write conjectures relating to perimeters and polygons. Working in cooperative learning groups, they use manipulatives and graphic organizers to solve problems then answer a series of questions in which they...
Curated OER
What are Quarters Made of?
Learners study the meaning, symbolism, and value of U.S. coins,
especially the quarter. They l research why in 1965 the U.S. Mint decided to
change the metal composition of the quarter to copper coated with zinc. In addition, they...
Curated OER
Seasons' Journey : Putting it All Together
Third graders complete a diagram of the revolution of the earth around the sun and write a one paragraph explanation of the factors that cause seasons.
Curated OER
Seasons' Journey: As the World Turns
Fourth graders explore the earth's revolution around the sun and the changes in weather that follow this motion.
Other popular searches
- Charts Graphs and Tables
- Tables, Graphs, Charts
- Graphs Charts Tables
- Maps, Charts, Graphs, Tables
- Charts, Tables, Graphs
- Charts, Graphs and Tables


