Curated OER
Putting Your Best Foot Forward
Third graders measure their feet and their parents' feet, record data on computer-generated graphs, and calculate and record mean, median, and mode.
Curated OER
Technology Literacy Challenge Grant Learning Unit
First graders explore counting and classification. They sort leaves, create graphs, write sentences for the data in the graphs, develop graphs for shapes, favorite animals, birthdays, and participate in a die prediction game.
Curated OER
Local Traffic Survey
Young scholars conduct a traffic survey and interpret their data and use graphs and charts to display their results.
Curated OER
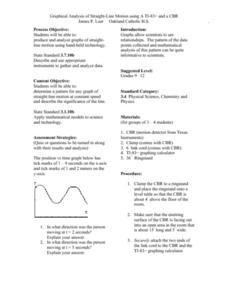
Graphical Analysis of Straight-Line Motion
Students investigate the concept of straight line motion. They determine the pattern and graph it looking for the motion maintained at a constant speed. Students also write a description of the significance of the line. The skill of...
Curated OER
Maps and Modes, Finding a Mean Home on the Range
Fifth graders investigate data from maps to solve problems. In this data lesson, 5th graders study maps and collect data from each map. Students present their data in a variety of ways and calculate the mode, mean, median, and range.
Illustrative Mathematics
Voting for Two, Variation 4
After elections, the total amount of votes is not specified but the ratio of votes is. Your learners' job is to determine the fraction of votes John received above half of all votes. The problem can be solved abstractly or by other...
Curated OER
Plugging Into The Best Price
Examine data and graph solutions on a coordinate plane with this algebra lesson. Young problem-solvers identify the effect of the slope on the steepness of the line. They use the TI to graph and analyze linear equations.
Curated OER
Building Sets of 13 and 14
Compose and decompose sets of 13 and 14 and compare sets of each with your little learners. They use objects to construct sets of 13 and 14, record their answers, and compare sets in several different ways.
Curated OER
Quilting Geometry
Study geometry through the concept of quilt design. High schoolers examine the geometric shapes in various quilts and then create their own quilts using geometric shapes that fit together. In the end, they write a paragraph to describe...
Curated OER
Matrices: A Secret Weapon
Students perform operations with matrices. In this algebra lesson plan, students use cryptography and cryptanalysis to solve problems. They add, subtract, and multiply matrices.
Curated OER
Vectors: Follow That Arrow
Vectors and their connection to motion. A video will be presented to provide information for the class to use methods of solving vectors with and without grids. Real-world physical concepts will be explored in reference to vectors.
Curated OER
Maximize It!
Students design a rectangular box without a lid that has the largest possible volume using the supplied sheet of centimeter graph paper. They work in groups to construct different size boxes to determine the largest possible volume and...
Curated OER
A Special Relationship
Young scholars discover the relationships of the lengths of the sides of right triangles and right triangles using a series of drawings on dot paper. They investigate and solve problems of standard (customary and metric units) and...
Illustrative Mathematics
Voting for Two, Variation 2
John won the election, but by how much more? Your learners will calculate how many votes each candidate received in order to determine the difference. Use with other lessons provided in the series to practice different variations of this...
Curated OER
Aerosol Lesson: Science - Graphing SAGE II Data
Students examine and plot atmospheric data on bar graphs.
Curated OER
Fun with Math using Magnetic Force
Sixth graders explore and discuss the effectiveness of magnets in different situations. In this math lesson, 6th graders discuss rate and graphs after exploring with magnets using different restrictions on the magnets. They analyze their...
Curated OER
You Can't Go Wrong with a Right Triangle 2
Upper graders use the properties of right angle trignonmetry to measure objects such as the school flagpole. They solve real world problems using these properties.
Curated OER
Probability: The Study of Chance
Students conduct an experiment, determine if a game is fair, and collect data. They interpret data, then display line graph. They conduct analysis of game for probability.
Curated OER
Shaking Up Ice Cream
Upper graders use a variety of tools to measure liquid and solid ingredients in an ice cream making recipe. Following written and oral directions and accurately timing themselves forms the basis of this lesson.
Curated OER
Fire!, Probability, and Chaos
Upper elementary and middle schoolers work with the concept of probability. They are introduced to the concept of chaos. Learners graph and analyze using a line plot, work with mean, and are introduced to the concept of variance.
Curated OER
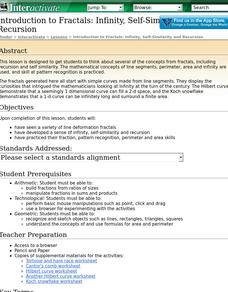
Introduction to Fractals: Infinity, Self-Similarity and Recursion.
This lesson introduces high schoolers to the ideas involved in understanding fractals. They develop a sense of infinity, self-similarity and recursion and
Curated OER
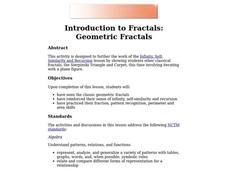
Introduction to Fractals: Geometric Fractals
Students study and observe the patterns made by the areas of the Sierpinski Triangle. Students use the computer to draw two or three iterations to discover the number patterns. Students complete worksheets based on Geometric Fractals.
Curated OER
The Demographics of Immigration: Using United States Census Data
Learners work together to analyze United States Census data on immigration. They compare and contrast the data and determine how immigration numbers have changed over time. They calculate percentages and make their own conclusions...
Curated OER
Anything I Can Do You Can Do Better
Students complete a two-week unit involving design and construction concepts. They watch a PowerPoint presentation about geometric shapes, draw the fourteen shapes incorporated in bridge construction, and in small groups design, build,...


