Curated OER
Graphing
Students collect data to create different types of graphs-line, pie, and bar graphs. They use StarOffice 6.0 to create graphs.
Curated OER
Equations in Motion: Design and construct a mobile
Learners participate in a lesson that covers the concepts of solving equations and inequalities. To master the concept they must demonstrate visually and verbally how both sides of an equation must be balanced. They construct a balanced...
Curated OER
Heads or Tails
Seventh graders compare experimental and theoretical probabilities. For this comparing experimental and theoretical probabilities lesson, 7th graders discuss the theoretical probability of flipping a coin. Students flip a...
Curated OER
Who Takes Care of the Maya Forest Corridor?
First graders study the animals in the Maya Forest Reserve. In this conservation lesson, 1st graders create a graph to compare the environment of animals to their own. They design a 3D model of these two environments.
Curated OER
Amazon Rainforest Conservation, Brazil
Students explore rain forests. In this rain forest lesson plan, students participate in a "BioBlitz" of their schoolyard, observing and recording every living thing in a designated area. Students visit websites about rain...
Curated OER
Discovering Pi
Students relate Pi to a circle. In this circles lesson plan, students identify the different properties of two dimensional objects. They relate Pi to the circumference, diameter and area of a circle .
Curated OER
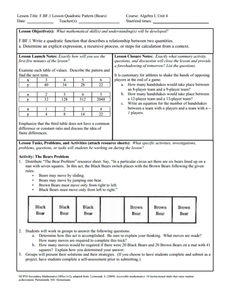
Bears
Students complete a variety of bear-related activities. They sort and graph teddy bears, distinguish between real and non-real bears and research bear life cycles and habitats.
Curated OER
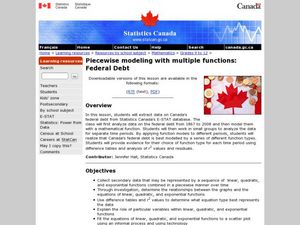
Piecewise Modeling with Multiple Functions: Federal Debt
High schoolers analyze data on debt and write an equation. In this statistics lesson, students are given data from different time periods, and are asked to graph and analyze the data. They work in groups, and are assigned different parts...
Curated OER
Food Pyramid Power: Looking Back and Moving Forward
Learners show their knowledge of properties of objects as it pertains to sorting and creating patterns. For this food pyramid power lesson, students show their ability to use whole numbers in different representations by appling...
Curated OER
Ohio Census 1990 & 2000
Students use Ohio census data to solve problems, make comparisons, draw conclusions, and support predictions related to Ohio's population. They interpret and work with pictures, numbers and symbolic information.
Curated OER
Life is Full of Problems
Pupils use the problem solving strategy of guess and check to investigate math word problems. They determine which problem solving strategy or strategies would work best in problem situations.
Curated OER
Monthly Cost of Living - Food
Young scholars determine how much they would need to feed a family for a month. They plan meals and use Internet grocery stores to find the cost of individual food items. They brainstorm in small groups to come up with 1 weeks worth of...
Curated OER
Collecting, organizing and comparing data for cellular telephone buying and calculating average, and median price and best deal per cost.
Students research data and develop statistical methods such as mean and median price and make convincing arguments as powerful ways for decision making.
Curated OER
Squares in the Light
Students collect and analyze data using a graph. In this algebra lesson, students explain their findings orally and with a graph. They use their knowledge to solve real life scenarios.
Curated OER
How Sharp Is Your Memory?
Students play a memory game as they explore reasoning. In this algebra lesson, students identify concepts using pictures and words. They model real life scenarios using hands on manipulatives.
Curated OER
Decode Word Is..
Students solve problems using patterns. In this algebra lesson, students identify the relation, domain and range of a function. They graph functions using coordinate pairs.
Curated OER
The Absolute Truth
Students solve problems of inequalities and equations. In this algebra lesson, students add, subtract, multiply and divide to solve inequalities. They graph their solutions on a number line.
Curated OER
Ohio Census 1990 and 2000
Students explore the Ohio census numbers in 1990 and 2000. In this social studies lesson, students use the census data to answer questions.
Curated OER
Putting Your Money to Work
Students create a collect data on expenses. In this algebra lesson, students create a spreadsheet to solve scientific equations. They incorporate math, science and technology in this lesson.
Curated OER
Know the System
Pupils identify the different systems of equations. In this algebra lesson, students solve systems of equations using graphing, elimination and substitution. They use the Ti to graph their systems.
Curated OER
Investing
Students collect data on investments and draw conclusions. In this algebra lesson, students analyze exponential graphs as they relate to money. They discuss the cause of an account balance being high or low.
Curated OER
Double, Double: Looking at the Effect of Change on Perimeter, Area and Volume
Young scholars explore perimeter, volume, and area. In this math lesson, students explore how changes in dimensions of geometric shapes affect the perimeter, area and volume of the various shapes. Young scholars investigate the results...
Pennsylvania Department of Education
Analyzing Numeric and Geometric Patterns of Paper Pool
Students use concrete and pictorial representation of geometric patterns to extend patterns. In this geometric patterns lesson plan, students identify patterns and extend them.
Curated OER
The Fat and the Lean
Students collect data on calorie intake. In this algebra lesson plan, students use the collection of data to make better eating decisions. They investigate the nutritional value in food using a graph and draw conclusion from their findings.


