Curated OER
Design-A-Room Project (Part 3 of 3)
Students culminate a unit on measurement with a focus on area and perimeter. They design a floor plan of their dream room on graph paper showing the proper area and perimeter. They plan the budget for their room and make a 3-D scale...
Curated OER
Marshland Wonders
Students review the characteristics of wetlands and list their benefits. After viewing short videos, they identify the organims that make their home in wetlands and how they have adapted. They compare and contrast the characteristics...
Curated OER
Arthropod Data Collection
Students describe the life cycle of various bugs as well as their predators and feeding habits. The class participates in a discussion of the various methods scientists use to gather data including research and experiment. After...
Curated OER
Earth Science: In Depth Look at Earthquakes
Students engage in an interactive Internet lesson covering the reasons and results of earthquakes. After reading eyewitness accounts and viewing animations, they use seismograms to measure and locate the epicenters. In an ongoing study,...
Curated OER
Identify Shapes and Matching Parts
Students identify real world objects as shapes they have learned. In this 3-D shapes worksheet, students identify shapes such as a cube for a box, a sphere for a globe, and a cylinder for a soup can.
Curated OER
Obstacles to Success: Misleading Data
Eleventh graders explore how data reported by country agencies can mislead the public intentionally or unintentionally. In this Cross Curricular activity, 11th graders analyze charts and graphs in order to draw conclusions. Students...
Curated OER
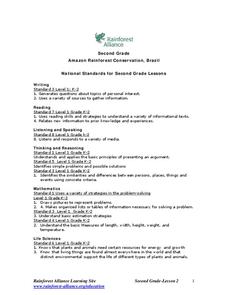
Amazon Rainforest Conservation, Brazil
Students explore the concept of understanding the effects of disturbances in an environment. In this life science lesson, students use the game Jenga to help capture the idea of environment disturbances. Students discuss the effects of...
Curated OER
Models and Algorithms to Solve Multiplication Problems
Students choose the correct strategy to solve multiplication and division. In this algorithm lesson, students use at least two strategies that use properties of operations and estimation. Students also recognize the relationship between...
Curated OER
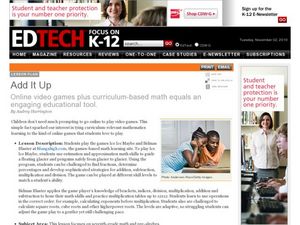
Online video games plus curriculum-based math equals an engaging educational tool.
Seventh graders use online math games to practice understanding the skill of estimation and order of operations. In this lesson, 7th graders use the internet to play online games to strengthen their understanding of these skills.
Curated OER
Introduction to Inverse Functions
Students investigate patterns of inverse functions. In this algebra lesson plan, students represent functions with the calculator and on paper. They analyze their data and draw conclusions.
Curated OER
The Search for Pythagoras' Treasure
Students identify and define properties of triangles. For this geometry lesson, students identify the missing sides and angles of right triangles. They use the rules of the Pythagorean Theorem to solve their problems.
Curated OER
Linking Real World Data to the Classroom
Students analyze data representing real life scenarios.In this algebra lesson, students collect, plot and analyze data using a graph. They use different methods to represent and present their data.
Curated OER
The Twelve Days of Christmas
Students purchase gift items and practice collecting, analyzing, computing, and recording information. In this data lesson plan, students also complete money equivalent activities.
Curated OER
Diameter, Radius and Area
Students calculate the diameter, radius and area of a circle. In this geometry lesson, students investigate the different ratios of a circle. They calculate the surface are of each circle.
Curated OER
Make Your Own "Weather" Map
High schoolers create their own "weather" map using data from x-ray sources. They analyze and discuss why it is important to organize data in a fashion in which is easy to read. They compare and contrast different x-ray sources using a...
Curated OER
Lesson 3: Lobster Roll!
Students play a game that illustrates the delicate ecological balance between fishing, fishing regulations and fish populations. They collect data and analyze the results.
Pennsylvania Department of Education
Alike and Different
Students compare and contrast objects and are introduced to a Venn Diagram. In this alike and different instructional activity, students make observations regarding properties of objects. Students classify object and build ideas about...
Curated OER
Toothpick squares
Students state the general rule for a practical situation. They describe a continuing pattern. They use toothpicks to help visualize the problem and answer it correctly.
Curated OER
Graphing With RXTE
High schoolers use data from the Rossi X-ray Tiiming Explorer (RXTE) satellite to analyze and graph.
Curated OER
Unifying Unlike Denominators
Students play roll of fictional radio disk jockeys. They allocate their daily program time into fractional time slots for the playing of specified catagories of music and commercial advertisements.
Curated OER
The Topsy-Turvy Twins
Fourth graders read the problem and brainstorm for ways to solve the problem - list these on the board for the students to refer to as they solve the problem. They work in pairs and focus on the strategy selected.
Curated OER
Graph and Compare the Adventure's Temperature Vs. Local Temperature
Students explore the concept graphing data. In this graphing data lesson, students use weather data from their local weather and some other city and graph them. Students plot the local weather vs. another city. Students record...
Curated OER
Drip, Drip, Drip
Students gather scientific data and be able to utilize the data to generalize results over a long period of time. They use the appropriate tools to measure quanities of liquids and analyze the data to determine the cost of a leaky faucet.
Curated OER
Virtual Field Trip / Route, Mileage and Gasoline Cost Graphs
Students use a spreadsheet program to graph and compare milage, gasoline costs and travel time for two travel routes in their virtual field trip in Michigan. They determine the most economical route based on the graphs and calculations.


