Curated OER
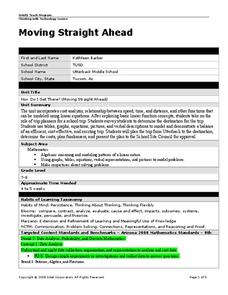
Moving Straight Ahead
Students analyze the relationship between speed, time and distance. In this math lesson, students plan a school trip. Students determine the efficiency and cost effectiveness of a trip.
Curated OER
Shh...It's a Secret!
Students explore codes, decode secret messages, and create codes of their own to use with their friends. They examine the use of gestures, letters, symbols and numbers in codes.
Curated OER
Where the Rubber Meets the Road
Eighth graders examine two different types of tires and the effects of different factors on the amount of force needed to overcome sliding friction such as when the vehicle tries to stop.
Curated OER
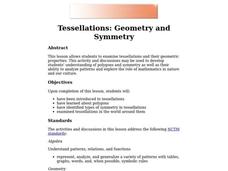
Tessellations: Geometry and Symmetry
Students examine tesselllations and their geometric properties. They have a better knowledge of polygons, can identify types of symmetry in tessellations. Also students use visulization, spatial reasoning, and geometric modeling to...
Curated OER
Introducing Trig
Fifth graders explore the importance of triangles in the real world. They find the unknown side of a right triangle using a scale drawing. Students use Pythagoras' Theorem and other appropriate ratios.
Curated OER
Global Statistics
Students select appropriate data to determine the mean, median, mode and range of a set of data. They calculate the statistical data on literacy rates and life expectancy within each geographic region of the world. Students determine...
Curated OER
Student Costs Graph
Learners calculate the mileage, gasoline costs, and travel time and costs for a vacation. They conduct a virtual field trip, and create a comparison graph of costs using Microsoft Excel software.
Curated OER
Go Figure! Using Percents in the Real World
Sixth graders solve sales tax problems. In this solving sales tax problems lesson, 6th graders find the sales tax on various items. Students are given a list of expenses that a family spent on vacation before taxes. ...
Curated OER
The 3R's: Rights, Rules, and Responsibilities
Eighth graders complete seven work stations that highlight math activities while they focus on the rules for Internet use and classroom rules for working in cooperative groups. After completing the activities, they complete a self-...
Curated OER
Algebra/Geometry Measurement
Fifth graders investigate units used to measure different geometric situations. In this geometry lesson, 5th graders measure length, mass, volume and temperature using units for measurements. They estimate the measurements before...
Curated OER
Drip, Drip, Drip or The Case of the Leaky Faucet
Students explore the cost of wasted water. In this math lesson, students conduct an experiment in which they collect data on how much water is lost when a faucet leaks. Students figure the cost of the water that was wasted.
Curated OER
Will Exams Be Cancelled?
If the flu outbreak continues, exams will have to be canceled. Investigate the properties of exponential and logarithmic functions. In this algebra lesson plan, students use the TI to examine and differentiate between exponential growth...
Curated OER
What's The Point?
Students solve word problems using the correct math symbols. In this algebra lesson, students use the TI calculator to graph their equation and analyze it. They find the line of regression and use to draw conclusion.
Curated OER
The Mandelbrot Set
High schoolers are introduced to the notion of a complex number and function iteration in order to motivate the discussion of Julia sets and the Mandelbrot set.
Curated OER
Lemonade Stand: Making Money the Old-Fashioned Way
Pupils run their own lemonade stand and are to figure out what to sell the lemonade at to gain the maximum profit.
Curated OER
Intro to Trigonometry
After being introduced to the basic trigonometry functions, middle schoolers calculate the height of school landmarks. They experiment with different angles to find the correct height.
Curated OER
A Statistical Look at Jewish History
Learners complete their examination over the Jewish Diaspora. Using population figures, they discover the importance of percentages in exploring trends. They use their own ethnic group and determine how it is represented in the United...
Curated OER
Creating Line Graphs
High schoolers draw line graphs. In this math instructional activity, students interpret minimum wage data and graph the data in a line graph. High schoolers predict the next minimum wage and figure the earnings for a 40 hour work week...
Curated OER
Impact!!
Students perform a science experiment. In this algebra instructional activity, students collect data from their experiment and create a graph. They analyze the graph and draw conclusion.
Curated OER
Mapping the Blue Part
Eighth graders determine the location of specific features of the stimulated ocean floor. The features include the continental shelf, continental slope, an ocean trench, and a mid-oceaniz ridge.
Curated OER
Discovering the Linear Relationship between Celsius and Fahrenheit
Students discover the linear relationship between degrees Farenheit and degrees Celsius. They manually compute the slope and y-intercept of the line passing through points. They convert Celsius to Fahrenheit degrees.
Curated OER
Determining the Age of Fossils
Students examine the concept of radioactive dating. In this radioactive dating lesson, students investigate how to determine the ages of fossils and rocks as they learn about half-life radioactive decay.
Curated OER
Car Maze competition
Young scholars use graphs to calibrate an RCX car. They must then program the car to traverse a maze using their calibrations
Curated OER
A Thanksgiving Survey
Learners take a survey then use the information gained from the survey to help plan a typical Thanksgiving dinner for our last day of class. They create a graph which corresponds the the data gathered during interviews.


