EngageNY
Understanding Box Plots
Scholars apply the concepts of box plots and dot plots to summarize and describe data distributions. They use the data displays to compare sets of data and determine numerical summaries.
Curated OER
Monster Data
An inventive lesson shows learners how to collect, organize, and present mathematical data. They access websites which lead them through a variety of ways to engage in data collection. They get to design and create graphs, and present...
Mathematics Assessment Project
Interpreting Distance–Time Graphs
Pre-algebra protégés critique a graph depicting Tom's trip to the bus stop. They work together to match descriptive cards to distance-time graph cards and data table cards, all of which are provided for you so you can make copies for...
Curated OER
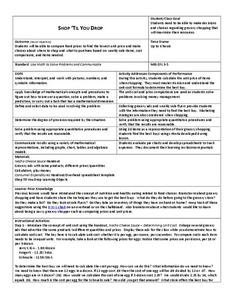
Shop 'Til You Drop
Students evaluate food prices. In this real world math lesson plan, students compare the cost of various grocery items to determine which is the best deal. They work in groups using grocery ads to decide how to get the most product for...
Curated OER
Peat Pots
Students place a peat pot in water to observe and calculate the rate of capillarity in a model of a soil. This task assesses students' abilities to make simple observations, collect, record, and represent data, use a data table to...
Curated OER
Completing Simple Tax Forms
Twelfth graders practice filling out IRS 1040 EZ forms. They discuss various ways people pay taxes. They assess the importance of W-2 forms and apply skills using the IRS tax table to compute how much money is owed or returned.
Curated OER
Statistics Canada
Students practice using graphing tools to make tables, bar charts, scatter graphs, and histograms, using census data. They apply the concept of measures of central tendency, examine the effects of outliers. They also write inferences and...
Curated OER
Does Your Field Measure Up
Students measure angles using a plane table kit. In this geometry lesson, students use trigonometric identities to find the values of the length of a football field.
Curated OER
Shrinky Dinks® Palettes
Here is a fun and clever lesson for teaching physics classes how to calculate wavelength if given the energy and frequency data. On a worksheet, they compute wavelengths using a table of information that you provide. On a paper palette,...
Curated OER
Interactivate: Introduction to Functions
This interactive website provides a variety of lesson plans according to which standards you are applying and which textbook you use. Introduce functions to your class by having them construct single operation machines and create...
Cornell University
Thin Films
Combine mathematics and science to calculate measurements of unmeasurable materials. Individuals use knowledge of density and volume to determine the thickness of the film used in production. They also apply stoichiometry to determine...
Serendip
Understanding and Predicting Changes in Population Size – Exponential and Logistic Population Growth Models vs. Complex Reality
Salmonella poisoning impacts over 200,000 people in the United States each year. Scholars learn about the growth of these bacteria using multiple approaches. Then they apply the same growth calculations to endangered species and think...
Curated OER
Exponential Growth versus Linear Growth II
Your algebra learners discover that exponential functions, with a base larger than one, outgrow linear functions when the inputs increase sufficiently. Their analysis includes using a graphing calculator to produce tables.
Curated OER
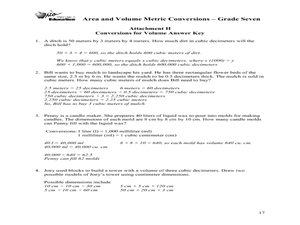
Area and Volume Metric Conversions - Grade Seven
Students investigate unit conversion. For this unit conversion lesson, students will build models of square and cubic centimeters using grid paper and generate formula tables for converting units of area and volume. The tables will be...
Curated OER
Our Solar System - Comparing Planetary Travel Distances
NASA presents a mini-unit on distances in our solar system. It incorporates scientific concepts of gravity, mass, density, and payload while your aspiring astronauts also employ mathematics skills. They calculate speed, they determine...
Space Awareness
The Climate in Numbers and Graphs
Weather versus climate: weather relates to short time periods while climate averages the weather of a period of many years. Scholars learn about average temperature and precipitation in various climate zones and then apply statistics...
Curated OER
Range, Cluster, Gap and Outliers
There are a number of activities here where learners collect and record data, as well as, activities where the likelihood of an event happening is calculated given the experimental probability. Young statisticians organize information...
Kent State University
How Does that Work?
Sixth and seventh graders explore algebra word problems. They work with a partner to solve word problems distributed by e-mail. Learners simplify mathematical expressions following a "think aloud" algebra strategy modeled by the teacher....
Curated OER
How Long Can You Go?
Eighth graders examine the usefulness of a line of best fit by collecting and graphing data, using a graphing calculator to determine the line of best fit, and making a variety of predictions. They watch a video, then design a...
PHET
CME Plotting
Young scientists build on their previous knowledge and apply it to coronal mass ejections. By plotting the path of two different coronal mass ejections, they develop an understanding of why most don't collide with Earth.
Illustrative Mathematics
Fixing the Furnace
This comprehensive resource applies simultaneous equations to a real-life problem. Though the commentary starts with a graph, some home consumers may choose to begin with a table. A graph does aid learners to visualize the shift of one...
Museum of Tolerance
Where Do Our Families Come From?
After a grand conversation about immigration to the United States, scholars interview a family member to learn about their journey to America. They then take their new-found knowledge and apply their findings to tracking their family...
EngageNY
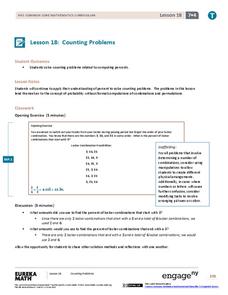
Counting Problems
Solving these percent problems is a matter of counting. Pupils find percents by counting the number of events that meet the criteria and the total number of possibilities. Participants create the ratio and convert it to a percent to...
Kenan Fellows
Weight and Balance of an Airplane
A career in aeronautics might be calling your class members. Building from the previous two lessons in the series, learners continue analyzing the mathematics of aeronautics. Groups create a paper airplane using paperclips for balance....


