Curated OER
Modeling Conditional Probabilities 1: Lucky Dip
Check out this detailed lesson plan on conditional probability! Learners work individually and also collaboratively to analyze the fairness of a game and justify their reasoning. it includes detailed notes and many helpful suggestions...
Curated OER
Access Ramp
Just about every public building that your students are familiar with has an access ramp which complies with ADA requirements. As it turns out, designing such a ramp is an excellent activity to incorporate slope, the Pythagorean Theorem,...
Noyce Foundation
Time to Get Clean
It's assessment time! Determine your young mathematicians' understanding of elapsed time with this brief, five-question quiz.
Inside Mathematics
Snakes
Get a line on the snakes. The assessment task requires the class to determine the species of unknown snakes based upon collected data. Individuals analyze two scatter plots and determine the most likely species for five additional data...
Savvas Learning
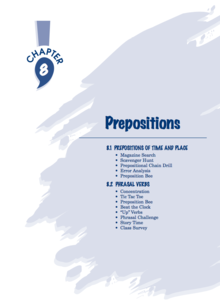
Prepositions
Learn about grammar the fun way! Eight activities about prepositions of time and place and phrasal verbs are sure to intrigue learners of all levels. Each activity requires minimal materials and set up, but will pay off in skills and...
South Gloucestershire Council
Animal Classification: A Collaborative Sorting Activity for Key Stages 2 & 3
Introduce the logic behind a dichotomous key or administer a group performance assessment with a fun and challenging classification lesson. With explicit instructions for the teacher and for collaborative groups, as well as engaging...
EduGAINs
Data Management
Using a carousel activity, class members gain an understanding of the idea of inferences by using pictures then connecting them to mathematics. Groups discuss their individual problems prior to sharing them with the entire class. The...
Noyce Foundation
Photographs
Scaling needs to be picture perfect. Pupils use proportional reasoning to find the missing dimension of a photo. Class members determine the sizes of paper needed for two configurations of pictures in the short assessment task.
Inside Mathematics
Vencent's Graphs
I like algebra, but graphing is where I draw the line! Worksheet includes three multiple-part questions on interpreting and drawing line graphs. It focuses on the abstract where neither axis has numbers written in, though both are...
Inside Mathematics
Graphs (2004)
Show your pupils that perimeter is linear and area is quadratic in nature with a short assessment task that requests learners to connect the graph and equation to a description about perimeter or area. Scholars then provide a...
West Contra Costa Unified School District
Talking About Distance, Rate and Time
Connect the tortoise and the hare fable to mathematics. Learners first identify key terms related to distance, rate, and time. They then solve distance/rate/time problems using different representations.
Inside Mathematics
Coffee
There are many ways to correlate coffee to life, but in this case a worksheet looks at the price of two different sizes of coffee. It requires interpreting a graph with two unknown variables, in this case the price, and solving for those...
Inside Mathematics
Swimming Pool
Swimming is more fun with quantities. The short assessment task encompasses finding the volume of a trapezoidal prism using an understanding of quantities. Individuals make a connection to the rate of which the pool is filled with a...
Inside Mathematics
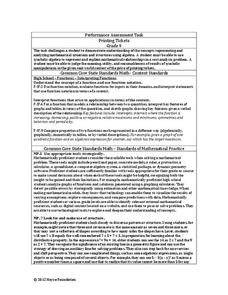
Printing Tickets
Determine the better deal. Pupils write the equation for the cost of printing tickets from different printers. They compare the costs graphically and algebraicaly to determine which printer has the best deal based upon the quantity of...
Noyce Foundation
Truffles
Knowing how to scale a recipe is an important skill. Young mathematicians determine the amount of ingredients they need to make a certain number of truffles when given a recipe. They determine a relationship between ingredients given a...
Inside Mathematics
House Prices
Mortgages, payments, and wages correlate with each other. The short assessment presents scatter plots for young mathematicians to interpret. Class members interpret the scatter plots of price versus payment and wage versus payment for...
Inside Mathematics
Graphs (2007)
Challenge the class to utilize their knowledge of linear and quadratic functions to determine the intersection of the parent quadratic graph and linear proportional graphs. Using the pattern for the solutions, individuals develop a...
Minnesota Literacy Council
Scientific Method
Here is a resource with a descriptive approach to explaining the scientific method. It's simple, but effective for both introduction and reinforcement of this concept.
Western Kentucky University
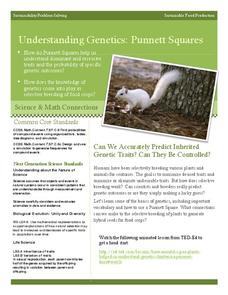
Understanding Genetics: Punnett Squares
Can scientists really predict genetic outcomes or are they simply making a lucky guess? Scholars first learn about Gregor Mendel and how to make Punnett squares. Then they extract DNA from a strawberry in a lab with included conclusion...
Inside Mathematics
Graphs (2006)
When told to describe a line, do your pupils list its color, length, and which side is high or low? Use a worksheet that engages scholars to properly label line graphs. It then requests two applied reasoning answers.
Noyce Foundation
Pizza Crusts
Enough stuffed crust to go around. Pupils calculate the area and perimeter of a variety of pizza shapes, including rectangular and circular. Individuals design rectangular pizzas with a given area to maximize the amount of crust and do...
Noyce Foundation
Sewing
Sew up your unit on operations with decimals using this assessment task. Young mathematicians use given rules to determine the amount of fabric they need to sew a pair of pants. They must also fill in a partially complete bill for...
Inside Mathematics
Quadratic (2009)
Functions require an input in order to get an output, which explains why the answer always has at least two parts. After only three multi-part questions, the teacher can analyze pupils' strengths and weaknesses when it comes to quadratic...
Inside Mathematics
Population
Population density, it is not all that it is plotted to be. Pupils analyze a scatter plot of population versus area for some of the states in the US. The class members respond to eight questions about the graph, specific points and...
Other popular searches
- Using Table of Contents
- Table of Contents Index
- Table of Contents Sheets
- Table of Contents Worksheets
- Using a Table of Contents
- Table of Contents and Index
- Table of Contents Learning
- Table of Contents Lessons
- Using the Table of Contents
- Table of Contents, Headings


