Inside Mathematics
Population
Population density, it is not all that it is plotted to be. Pupils analyze a scatter plot of population versus area for some of the states in the US. The class members respond to eight questions about the graph, specific points and...
Curated OER
Hobbies Lesson Plan #2
Explore different physical activities with your French classes! Learners complete three exercises here to develop sports-related vocabulary. First, they find various benefits for a list of sports. Then, they match the accessories...
Curated OER
Systems of Equations and Inequalities
This is a comprehensive lesson on creating and solving equations and systems of equations and inequalities. Problems range from basic linear equations to more complex systems of equations and inequalities based on a real-world examples....
Noyce Foundation
Granny’s Balloon Trip
Take flight with a fun activity focused on graphing data on a coordinate plane. As learners study the data for Granny's hot-air balloon trip, including the time of day and the distance of the balloon from the ground, they practice...
Achieve
Dairy Barn
Agriculture is truly a math-based profession! Help the dairy farmer determine the supplies needed to complete his barn. Using given dimensions, learners build equations and use units to determine the correct amount of materials.
Achieve
Corn and Oats
How much land does a parcel hold? How much fertilizer does it take for a field of corn? Pupils answer these questions and more as they apply ratio reasoning and unit analysis.
Achieve
Rabbit Food
Keep your pets slim, trim, and healthy using mathematics! Pupils use a linear programming model to optimize the amount and type of food to provide to a pet rabbit. They model constraints by graphing inequalities and use them to analyze a...
Achieve
Ivy Smith Grows Up
Babies grow at an incredible rate! Demonstrate how to model growth using a linear function. Learners build the function from two data points, and then use the function to make predictions.
Achieve
Yogurt Packaging
Food companies understand how to use math to their advantage. Learners explore the math related to the packaging and serving size of yogurt. They then use unit analysis and percent values to make decisions on the product development.
Achieve
Ground Beef
Ever wonder how a butcher creates the different types of ground beef? Young mathematicians explore the methods butchers use to create their desired ground beef quality. Given a combination of two types of meat with varying leanness,...
Achieve
Greenhouse Management
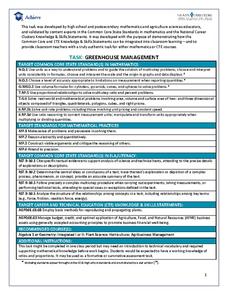
Who knew running a greenhouse required so much math? Amaze future mathematicians and farmers with the amount of unit conversions, ratio and proportional reasoning, and geometric applications involved by having them complete the...
Inside Mathematics
Expressions
Strive to think outside of the quadrilateral parallelogram. Worksheet includes two problems applying prior knowledge of area and perimeter to parallelograms and trapezoids. The focus is on finding and utilizing the proper formula and...
Noyce Foundation
Lawn Mowing
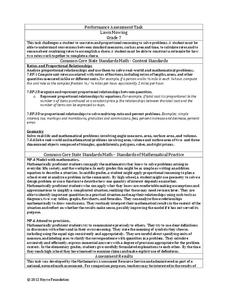
This is how long we mow the lawn together. The assessment requires the class to work with combining ratios and proportional reasoning. Pupils determine the unit rate of mowers and calculate the time required to mow a lawn if they work...
Inside Mathematics
Squares and Circles
It's all about lines when going around. Pupils graph the relationship between the length of a side of a square and its perimeter. Class members explain the origin in context of the side length and perimeter. They compare the graph to the...
California Education Partners
Photos
Why do all sizes of pictures not show the same thing? Class members analyze aspect ratios of various sizes of photos. They determine which sizes have equivalent ratios and figure out why some pictures need to be cropped to fit particular...
Curated OER
Writing Process Review for Grade 2
In this writing process review for grade 2 worksheet, 2nd graders answer 15 multiple choice questions in standardized test format about reference skills.
Curated OER
Research questions
In this research worksheet, students answer multiple choice questions about different research items. Students complete 12 questions about the internet, different resources, and more.
Curated OER
Integrating Functions
In this math activity, students find the answers to the functions that includes integration and trigonometry. They use the examples for help with the special functions.
Curated OER
2nd Grade Language Practice
In this language practice worksheet, students complete a total of 25 multiple choice questions related to a variety of 2nd grade language concepts. An answer key is included.
Curated OER
Using Inequalities to Problem Solve
Students explore inequalities. For this Algebra I lesson, students solve and graph linear inequalities involving addition, subtraction, multiplication, or division. Students use inequalities to solve and graph real-world problems.
Government of Alberta
Learn Alberta: Math Interactives: Exploring Election Data
Using actual Alberta provincial election results, students have the opportunity to interpret election data using a variety of graph types. Pictographs, line graphs, bar graphs, circle graphs, and data tables are covered in this...
Government of Alberta
Learn Alberta: Math Interactives: Exploring Data Display and Graphs
This multimedia Learn Alberta math resource focuses on graphing data. In the video portion, students will see how math is involved in the display of merchandise in stores. The accompanying interactive component provides an exploration...


