Curated OER
Using Radiosonde Data From a Weather Balloon Launch
Student use radiosonde data from a weather balloon launch to distinguish the characteristics of the lower atmosphere. They learn the layers of the atmosphere. They graph real atmospheric data.
Curated OER
Using Details From the Text To Identify Cause and Effect
Students word in groups to come up with cause and effect situations based on texts they are reading. In this cause and effect lesson plan, students record these in their literary response journals.
Curated OER
Interpreting and creating tables
Young scholars observe examples and discuss how to interpret them. They then
brainstorm examples of possible questions students could use to create a table. They take time to formulate a question and collect data.
Curated OER
Volume, Mass, and Weight
Study the difference between mass and weight. Your math group will compare the weight of an item to the amount of space that it uses. They'll then use conversion factors to find the difference between kilograms and pounds. Essential...
Cornell University
Math Is Malleable?
Learn about polymers while playing with shrinky dinks. Young scholars create a shrinky dink design, bake it, and then record the area, volume, and thickness over time. They model the data using a graph and highlight the key features of...
Kenan Fellows
Sustainability: Learning for a Lifetime – The Importance of Water
Water is essential for life—and understanding the importance of clean drinking water is essential in understanding sustainability! Show your environmental science class the basics of water testing and treatment through a week-long...
Pennsylvania Department of Education
Volume and Surface Area
Build boxes using unit cubes to compare surface area and volume. The group performs multiple experiments to determine properties of volume, such as if it makes a difference which order the dimensions are multiplied in. Extensive...
Cornell University
What Happens When We Excite Atoms and Molecules?
Excited atoms lead to exciting lessons! Learners use heat and light to excite both atoms and molecules. They display their learning in the form of Bohr models depicting the excited state of the atoms.
Curated OER
Graphing the Forecast - Line Graph or Bar Graph?
Sixth graders compare and contrast bar and line graphs. Using a weather forecast of the area, 6th graders record the high and low temperatures in a table. Students determine and justify the most appropriate graph to display a given set...
Sunburst Visual Media
Clouds
Support science instruction with a combination of engaging activities and skills-based worksheets that focus on clouds. Learners take part in grand discussions, write an acrostic poem, complete graphic organizers, solve word puzzles, and...
US Department of State
The Marshall Plan: The Vision of a Family of Nations
The European Recovery Act (aka the Marshall Plan) was designed to bring together and develop a spirit of cooperation among European nations after World War II. Class members examine the materials from the Marshall Plan exhibit and assess...
Mathematics Vision Project
Module 1: Functions and Their Inverses
Undo a function to create a new one. The inverse of a function does just that. An inquiry-based lesson examines the result of reversing the variables of a function, beginning with linear patterns and advancing to quadratic and...
Sargent Art
Metal Embossing Weathervanes
Metal work has been used for hundreds of years. Ninth graders get a chance to experience the artistry of metal embossing in this highly structured lesson. Each step is accented with a helpful image and related instruction. The end...
Mathed Up!
Pie Charts
Representing data is as easy as pie. Class members construct pie charts given a frequency table. Individuals then determine the size of the angles needed for each sector and interpret the size of sectors within the context of frequency....
Yummy Math
Starbucks Drinks
The casual language and popular topic will make this assignment all the more engaging for your middle school math class. They use Starbucks beverage sales and nutrition values to practice ratios, proportions, statistics, and...
Cornell University
Electroplating
Silver pennies and copper nickels are made possible by applying some chemistry. Learners use electrolysis to coat a penny with zinc sulfate and a nickel with copper sulfate. Their investigation builds an understanding of electroplating...
Curated OER
Build a Bar Graph
Learners discover how to use bar graphs. They will gather and organize specific data in order to put it into a bar graph. Then they will answer several questions based on the information they have graphed.
Curated OER
Many Ways to Represent Our Data
Demonstrate several ways to represent data with your class. They will use surveys to gather data and display the data using tally charts and graphs. Then answer questions according to the data.
Guidance Group
101 Ways to Teach Children Social Skills
Increasing pressure to improve student achievement has made it easy to overlook the social skills they also need to develop. With this collection of worksheets and activities, you'll be able to improve children's communication, teamwork,...
Education Fund
Fear the Scarce Resources
In a life or death situation, what resources would you choose to survive—and why? A zombie attack simulation teaches learners the concepts of scarcity and resources in regards to economics. The hands-on activity requires individuals to...
Bully Free Systems
Bully Free Lesson Plans—Eighth Grade
Middle schoolers are likely very familiar with the concept of bullying and cliques. Discuss their experiences and brainstorm ways to handle peer conflict and feelings of exclusion with a poem that focuses on bullying, and a second lesson...
CCSS Math Activities
Smarter Balanced Sample Items: 7th Grade Math – Claim 2
To solve or not to solve that is the problem. A slide presentation of 17 items show different ways that Smarter Balanced assesses Claim 2, problem solving. The items span from sixth and seventh grade concepts to highlight the...
Yummy Math
Hot Summer. . . Cold Winter
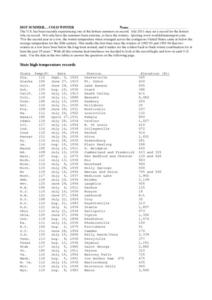
A table of each state's record temperature reports data that middle schoolers can place on a number line for analysis. A written explanation of how to use this tool and the concept of absolute value are also included. Nine questions are...
National Wildlife Federation
An Inconvenient Truth in the Classroom
Global warming — what a hot topic! A thorough unit challenges learners to research, read, explore, and write about carbon, its role and increasing nature in our atmosphere, and how global warming is affecting lives and environments...


